


Agronometrics in Charts: Peruvian blueberry exports reaching record highs


In this installment of the ‘Agronometrics In Charts’ series, Sarah Ilyas studies the state of the Peruvian blueberry season. Each week the series looks at a different horticultural commodity, focusing on a specific origin or topic visualizing the market factors that are driving change.


Peruvian blueberry exports increased by 119% in the first half of the year, totaling 146.5 million dollars, according to The Commission to promote Peruvian Exports and Tourism (PROMPERÚ).
In this campaign, at the departmental level, La Libertad has been the most productive region that has contributed the most to exports with 57% of the volume. It is followed by Lambayeque with 26%, Ancash with 11%, Ica with 3%, Lima with 2%, Piura with 1%, and Moquegua with 0.3%.
The primary importer was the United States with $86.3 million, followed by the Netherlands. In the same period, the United Kingdom almost tripled its purchases of Peruvian blueberries (11.4 million dollars/320.4%) and China increased its purchases by 380.6% to 8.8 million dollars.
At this rate, roughly 250,000 tons are expected to be exported by the end of the campaign, implying that exports would grow by more than 25% over the previous year.
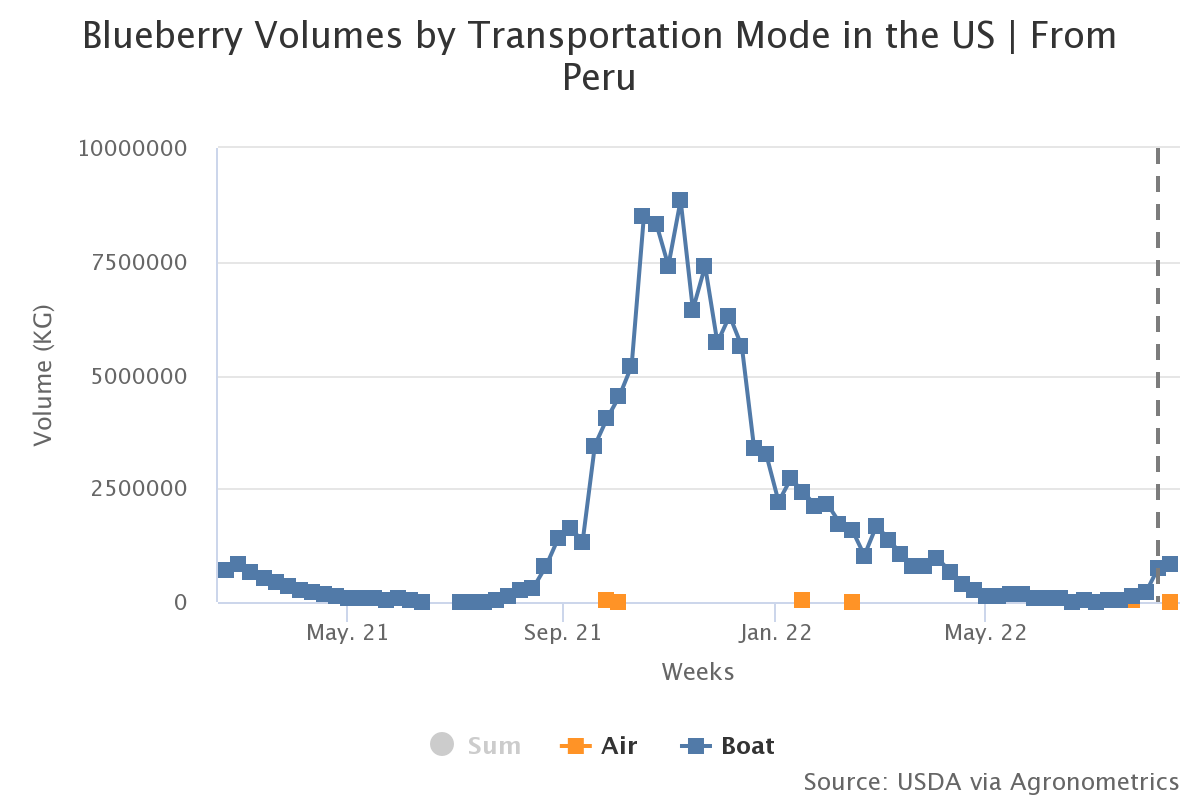
According to estimates, 90% of shipments would be exported between August and December, and 50% between September and October. Week 32 saw a total of 821 K kgs of Peruvian blueberries entering the US market.

Source: USDA Market News via Agronometrics. (Agronometrics users can view this chart with live updates here)
Peru exported more than 10,000 tons of blueberries between May and the end of July; a higher volume than at the beginning of the previous campaign. 92% of this volume was shipped by sea and 8% was shipped by air.
Source: USDA Market News via Agronometrics. (Agronometrics users can view this chart with live updates here)
As for pricing this month, it’s expected to fall in line with historical pricing--unlike July when record pricing was recorded. Prices are expected to remain steady and provide promotional opportunities.

Source: USDA Market News via Agronometrics. (Agronometrics users can view this chart with live updates here)
Peru has experienced explosive growth in the blueberry sector over the last decade and its dominance in the world blueberry market is only expected to grow, with blueberries now ranking as the country’s second most important agricultural export after table grapes.
Some setbacks currently faced by the industry include the high costs of sea freight and importing inputs, such as fertilizers, lack of enough space on ships and increasing demand.
In our ‘In Charts’ series, we work to tell some of the stories that are moving the industry. Feel free to take a look at the other articles by clicking here.
All pricing for domestic US produce represents the spot market at Shipping Point (i.e. packing house/climate controlled warehouse, etc.). For imported fruit, the pricing data represents the spot market at Port of Entry.
You can keep track of the markets daily through Agronometrics, a data visualization tool built to help the industry make sense of the huge amounts of data that professionals need to access to make informed decisions.
If you found the information and the charts from this article useful, feel free to visit us at www.agronometrics.com where you can easily access these same graphs, or explore the other 21 commodities we currently track.


Subscribe to our newsletter


