


Agronometrics in Charts: Devastated Pacific Northwest cherry season pushes prices to historic levels


In this installment of the ‘Agronometrics In Charts’ series, Sarah Ilyas studies the state of the Pacific Northwest’s cherry season. Each week the series looks at a different horticultural commodity, focusing on a specific origin or topic visualizing the market factors that are driving change.


According to the Northwest Horticultural Council, 20 million boxes of cherries were produced last year by growers in Washington, Oregon, Idaho, Montana and Utah, valued at nearly a billion dollars. This year, a cold and wet spring stunted the development of many cherries, leading to what is, ostensibly, the smallest crop of Northwest sweet cherries in nearly 14 years.
The crop is reported to be 80,000 tons short owing to a severe winter storm experienced by Washington and Oregon on April 14 which reduced fruit set and pollination and caused damage to blossoms.
Cherries are the first fruit to be harvested in Washington each year and are therefore more susceptible to capricious weather and temperature fluctuations in the spring. After pollination, cherry buds require consistent warm spring days to swell and develop into fully mature cherries.
According to B.J. Thurlby, the president of both the Washington State Fruit Commission and Northwest Cherries, a snow event during the cherry bloom has not happened before, he went on to add that the crop is the smallest since 2008 and that the crop should finish up at 130,000 tons going to the fresh market.
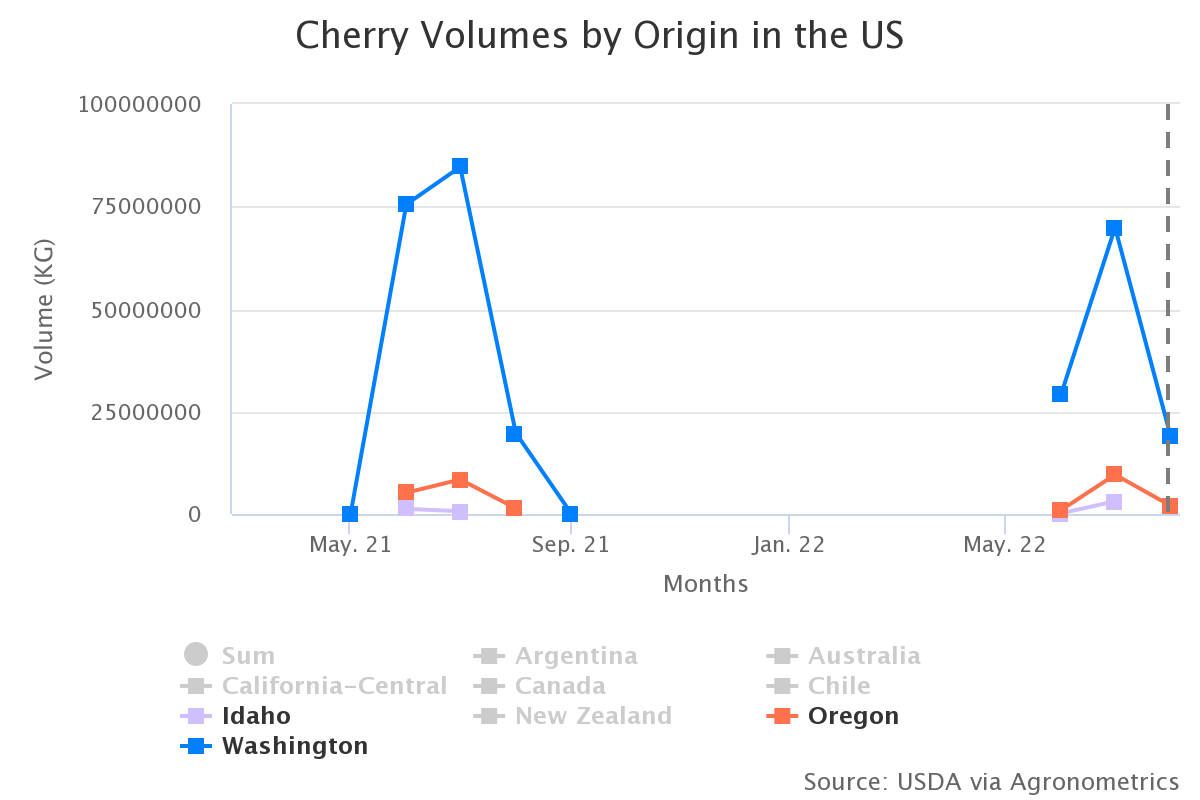
(Source: USDA Market News via Agronometrics. Agronometrics users can view this chart with live updates here)
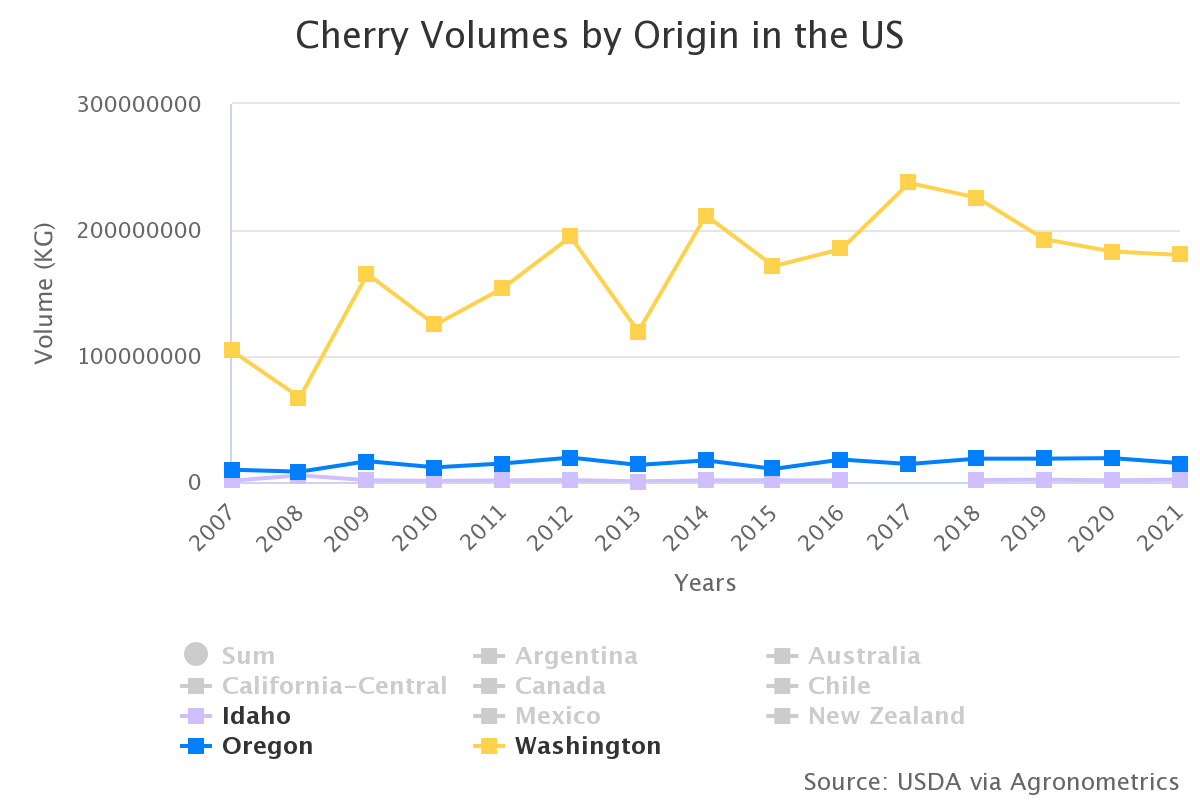
(Source: USDA Market News via Agronometrics. Agronometrics users can view this chart with live updates here)
Prices escalated to historic levels this season, reaching $76.78 per package during week 27, in line with supply tightness and shortages. Week 31 saw prices at $45.58 per package, a 42 percent hike compared to the previous season.
There is also a high degree of uncertainty surrounding the financial sustainability of the industry. Growers are faced with exorbitant energy and labor costs. With packaging costs also climbing, profit margins have reduced. This level of inflation in input prices could potentially discourage growers.
According to Karina Gallardo, an economist at The Washington State University, labor costs have risen to $21.76 for hand labor and $23.01 for tractor drivers and irrigators. (Having increased from $20.43 and $21.68, respectively, in 2021).

(Source: USDA Market News via Agronometrics. Agronometrics users can view this chart with live updates here)
Growers in North America, however, are perseverent and resilient to challenges. Many growers have begun investing in newer varieties that are self-pollinating, more fertile and resistant to adverse growing conditions.
These factors are likely to support the future of the industry, to ensure that production flourishes.
In our ‘In Charts’ series, we work to tell some of the stories that are moving the industry. Feel free to take a look at the other articles by clicking here.
All pricing for domestic US produce represents the spot market at Shipping Point (i.e. packing house/climate controlled warehouse, etc.). For imported fruit, the pricing data represents the spot market at Port of Entry.
You can keep track of the markets daily through Agronometrics, a data visualization tool built to help the industry make sense of the huge amounts of data that professionals need to access to make informed decisions. If you found the information and the charts from this article useful, feel free to visit us at www.agronometrics.com where you can easily access these same graphs, or explore the other 21 commodities we currently track.


Subscribe to our newsletter


