


Agronometrics in Charts: And after 4 weeks…


Guest article by Diego Castagnasso, a fresh produce and blueberry industry expert. Loud, opinionated, INFORMED! Diego writes DC’s B-Side’s newsletter as he speaks and speaks as he writes. You can subscribe, under your own peril, to his newsletter here or visit his less fun (for now) website Drip Consulting.


And after 4 weeks, here we are…
…ready to catch up with the Start of the 2025-26 Peruvian Blueberry Season?
Peru Fresh Blueberry Exports By Partner | Cultivated Conventional
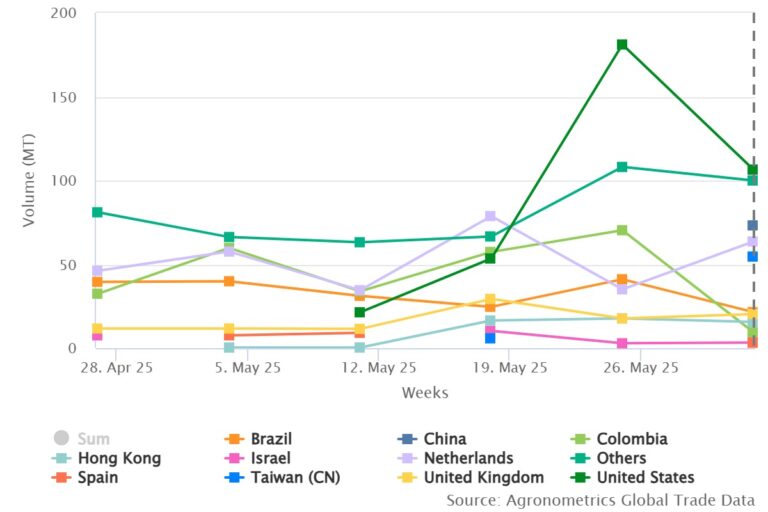
Source: USDA Market News via Agronometrics.
(Agronometrics users can view this chart with live updates here)
- Clearly, the START belongs to the “OTHER” markets, with 868.961 kg shipped out of a total of 1.553.011 kg (Proarandanos) or 1.782.600 kg (Agronometrics).
- Forecast-wise… (using just Proarandanos numbers), I let you choose.
- May’s forecast -26%
- June’s forecast 3%
- The new forecast has less fruit programmed, around -1.780.000kg
So why the change?
That is a question that we will probably answer in “The DC's B-Side & Agronometrics Peru’s Blueberry Forecast 2025” on June 12th.
I hope you are one of the 30 “visionaries” there!
Oh! You didn’t bid?... Well, maybe next time, now the bidding is closed!
And that’s it for this week…
What?
Yes! Have a GREAT WEEK!
And remember, if you liked what you read, send it to a friend; if not, unsubscribe…
PS: Yes… You know, we usually start the season with some differences between Proarandanos and Agronometrics…
So....Business as usual.
Let’s see if the numbers grow apart or not?
PS1: While analyzing the new forecast and what had happened in the last 4 weeks, I came across something that made me think…
Isn’t it odd that although Biloxi is being replaced and Emerald is an “old” variety, those 2 are leading the exports?
Here is some info so you can compare the last few years and the top varieties being exported, something else catches your eye?
*In Red because of “EL NIÑO”
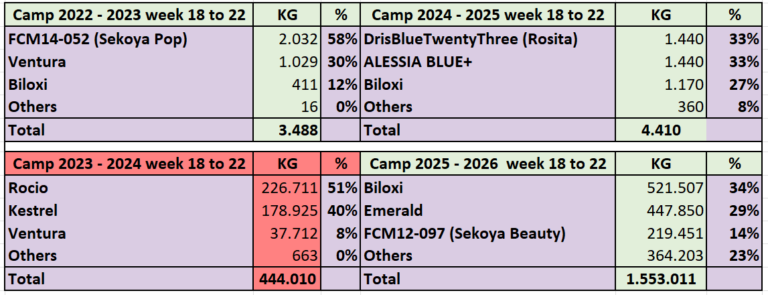 Source: USDA Market News via Agronometrics.
(Agronometrics users can view this chart with live updates here)
In our ‘In Charts’ series, we work to tell some of the stories that are moving the industry. Feel free to take a look at the other articles by clicking here.
All pricing for domestic US produce represents the spot market at Shipping Point (i.e. packing house/climate controlled warehouse, etc.). For imported fruit, the pricing data represents the spot market at Port of Entry. You can keep track of the markets daily through Agronometrics, a data visualization tool built to help the industry make sense of the huge amounts of data that professionals need to access to make informed decisions. If you found the information and the charts from this article useful, feel free to visit us at www.agronometrics.com where you can easily access these same graphs, or explore the other 21 commodities we currently track.


Subscribe to our newsletter


