


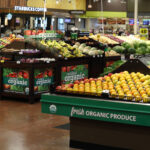
Avocados in Charts: Peru - An opening window of opportunity


In this 'in charts' mini-series of articles, Colin Fain of data visualization tool Agronometrics illustrates how the U.S. market is evolving. In each series, he will look at a different fruit commodity, focusing on a different origin in each installment to see what factors are driving change.


This is the third installment of the 'in Charts' mini-series on avocados. This week we take a deeper dive into Peru’s season and the role it is playing in the U.S. market.
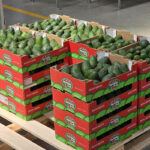
Peru has a golden opportunity to produce right when the market most needs it - when the U.S.'s biggest supplier is least capable of delivering. Coming in on the heels of California, Peru happens to be countercyclical to the Mexican season, hitting a perfect window of opportunity.
Avocado Movements (in pounds) 2017

(Source: USDA Market News via Agronometrics)
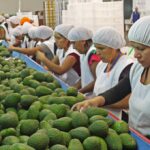
Another prominent feature of the Peruvian season is the rate at which it has been growing, rushing to keep up with demand right in the middle of the U.S. summer. In 2010 the U.S. Department of Agriculture (USDA) reported 300,000 pounds of imports from Peru, while in 2017 we saw Peru send an impressive 126 million pounds.
Avocado Movements (in pounds), Peru

(Source: USDA Market News via Agronometrics)
The impressive growth isn’t just a coincidence - pricing for avocados has been keeping up and even surpassing the industries expectations. June, July and August - right where Peru is most prominent - have seen some of the highest levels to date.
These high prices are not only produced by high demand from consumers, they are also a sign that producers are having a hard time keeping up with the market. Fortunately for consumers, there are three major origins trying to feed the U.S.’s hunger for avocado during this time. Growth has been so steep though that to create a stable market a complex symphony between all origins is necessary. If any one of these origins lets up, big spikes in prices follow, such as we saw the last two years.
Hass Avocado Shipping Point prices in USD (Cartons 2 Layer), Average Historic Comparison

(Source: USDA Market News via Agronometrics)
It’s not all rosy though, and there is still some work that Peru can do to improve its positioning in the market. Compared to the market average, Peru's prices come in at an average of US$2.00 lower. Unfortunately, the USDA's Pricing data doesn’t give any direct insight on fruit quality, negotiating terms, or why there is such a variance, but it is relatively safe to say that there could be some room for improvement.
Hass Avocado Shipping Point prices in USD (Two-layer cartons)

(Source: USDA Market News via Agronometrics)
Feel free to take a look at the other articles in this avocado series:
Avocados in Charts: Dynamic growth and opportunities in the U.S. market
Avocados in Charts: California - At the heart of the U.S. market
Agronometrics is a data visualization tool built to help the industry make sense of the huge amounts of data that you depend on. We strive to help farmers, shippers, buyers, sellers, movers and shakers get an objective point of view on the markets to help them make informed strategic decisions. If you found the information and the charts from this article useful, feel free to visit us at www.agronometrics.com where you can easily recreate these same graphs, or explore the other 20 fruits we currently track, creating your own reports automatically updated with the latest data daily.
If you would like to prioritize any particular commodity, please let us know in the comments.


Subscribe to our newsletter


