Agronometrics in Charts: Blueberry Coalition publishes analysis in response to ITC investigation


In this ‘Agronometrics In Charts’ series, Colin Fain illustrates how the U.S. market is evolving. Each week the series looks at a different horticultural commodity, focusing on a specific origin or topic visualizing the market factors that are driving change.


This week's article takes a different tone from our normal publications. I want to take the opportunity to highlight the work Thomas Prusa did, analyzing the blueberry markets for the Coalition for Progress and Health, an organization that was formed in response to the USITC section 201 investigation which opposes US import limitations.
Before this takes a political tone, it’s important to highlight that Agronometrics is not taking a stance in the investigation. We have clients who are on either side and we look to support every subscriber with the same data and the same level of customer service.
Dr. Prusa, a professor of economics at Rutgers University, and a consultant to the coalition hired our service shortly after the US Trade Representative made the formal request to the USITC to initiate the section 201 investigation. As a customer of our service, we helped explain how to use the Agronometrics platform and make sense of the USDA data as we would do with any other client.
The resulting report, An Economic Analysis of the Competitive Dynamics in the U.S. Fresh Blueberry Market is a very interesting study on the blueberry markets. Dr. Prusa dove deep into the datasets that the USDA, IBO, USHBC, and others, comparing and contrasting different sources of information to form the most complete view of the US blueberry industry’s data that I have come across.
The report was created to help the coalition's lawyers argue their case before the USITC, so it clearly makes an effort to demonstrate there is little effect on the competitiveness of US producers. Although I don't necessarily agree with all the findings, there are many interesting insights to be gained including novel ways that the data from the Agronometrics platform can be visualized. In what follows I have cut and pasted some figures and tables from Dr. Prusa’s report (which explains the odd figure and table numbering).
Figure 5 - Lack of Temporal Overlap of Supply (2019)

Source: USDA AMS Weekly Nonorganic & Organic Volume (“Movement”) Data (as compiled by Agronometrics); adjusted Canadian data (APHIS undercount).
One thing the report does very well is to offer an in-depth analysis of the US markets. The information will not surprise long term observers of the industry, suggesting that efficiencies in production and newer varieties with desirable commercial characteristics are driving growth and profitable businesses.
Origins that have not been investing in their fields are not faring as well. Comparing yield analysis with growth from different regions is very telling, showing strong growth from the west coast where yields are high compared with the decrease in production from “traditional producers” where yields are low.
Table 7 – Yield Trends (U.S.)
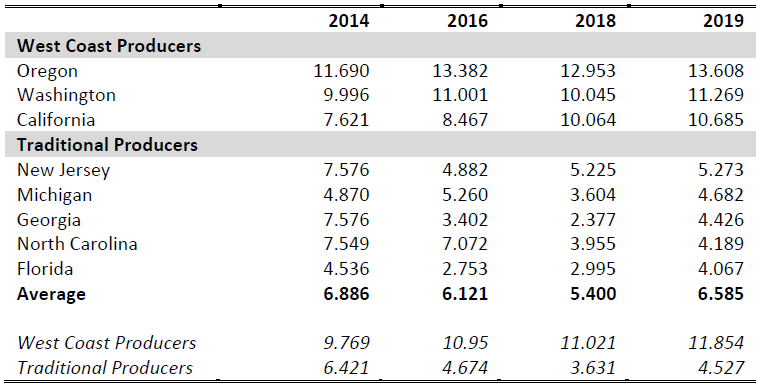
Source: International Blueberry Organization, https://www.internationalblueberry.org/ (yield measured as metric tons production/hectare)
Figure 12 – Growth in West Coast Supply in Second Half of Peak Season


Source: USDA AMS Weekly Nonorganic & Organic Volume (“Movement”) Data (as compiled by Agronometrics).
Another interesting chart looks at the seasonality of production comparing Western producers from the rest of the country. It does a good job illustrating how the US market is split into two separate worlds.
Figure 7 – Competitive Overlap of Domestic Producers

Source: USDA AMS Weekly Nonorganic & Organic Volume (“Movement”) Data (as compiled by Agronometrics); peak season is defined as weeks 17 through 36; the number in parenthesis is each state’s share of annual domestic fresh blueberry shipments.
The report even dives deeper, expanding on the varieties that are being used in different markets with the western states clearly more invested in newer varieties and genetics while traditional producers are lagging behind.
Table 17 – West Coast Producers Embrace New Varieties 36

36 Affidavit of Soren Bjorn, Driscoll’s of the Americas (Appendix B).
Table 18 – Traditional Producers Predominantly Grow Older Varieties37

37 Affidavit of Soren Bjorn, Driscoll’s of the Americas (Appendix B).
As this article goes to press, the hearing for the US ITC investigation is being held. Through this process, it is the vote of the five commissioners that will decide whether or not there will be a recommendation of imposing trade restrictions.
That said, the report by itself has much to offer including information on imports, pricing, and an econometric model measuring the impact of imports on domestic growers.
I encourage anyone in the blueberry industry to take a look at it as there are plenty of valuable insights to be gained.
In our ‘In Charts’ series, we work to tell some of the stories that are moving the industry. Feel free to take a look at the other articles by clicking here.
You can keep track of the markets daily through Agronometrics, a data visualization tool built to help the industry make sense of the huge amounts of data that professionals need to access to make informed decisions. If you found the information and the charts from this article useful, feel free to visit us at www.agronometrics.com where you can easily access these same graphs, or explore the other 20 fruits we currently track.


Subscribe to our newsletter