


Agronometrics in Charts: Volumes of Texas citrus begin to dry up in the market


In this installment of the ‘Agronometrics In Charts’ series, Colin Fain illustrates how the U.S. market is evolving. Each week the series looks at a different horticultural commodity, focusing on a specific origin or topic visualizing the market factors that are driving change.


With all the news of Texas regarding the freezes caused by winter storm Uri, the fresh produce industry is rightfully concerned about what kind of impact it will have on their livelihoods. A recent article in FreshFruitPortal.com was published on the subject of the Texas A&M AgriLife Extension Service, quotes losses estimated at USD $300 Million.
The two categories most affected are expected to be grapefruit and oranges.
Grapefruit
The same article stated that only 67% of the grapefruit season had been harvested with little to no volume expected to be produced from here forward. In the chart below we can see what that deficit looks like compared to the previous year. It is likely that any volumes that we see coming onto the market will be leftover inventory clearing out of the supply chain.
Grapefruits from Texas, Non-Organic | Volumes by History (Lbs)

(Source: USDA Market News via Agronometrics. Agronometrics users can view this chart with live updates here)
Pricing will likely also be affected, and we are already seeing that reports of grapefruit prices stopped being reported by the USDA on Wednesday the Feb. 17. This is indicative of volume being taken out of the spot market, meaning that any fruit that is available is going straight to program.
Grapefruits from Texas, Non-Organic | Prices by History (7/10 Bushel Cartons)
(Source: USDA Market News via Agronometrics. Agronometrics users can view this chart with live updates here)
Oranges
Oranges have been slightly less affected, with an estimated 80% of the season harvested before the freeze came in, according to Juan Anciso of Texas A&M. Like with grapefruit, it is likely that any volumes that we see coming into the market will be leftover inventory clearing out of the supply chain.
Oranges from Texas, Non-Organic | Volumes by History (Lbs)

(Source: USDA Market News via Agronometrics. Agronometrics users can view this chart with live updates here)
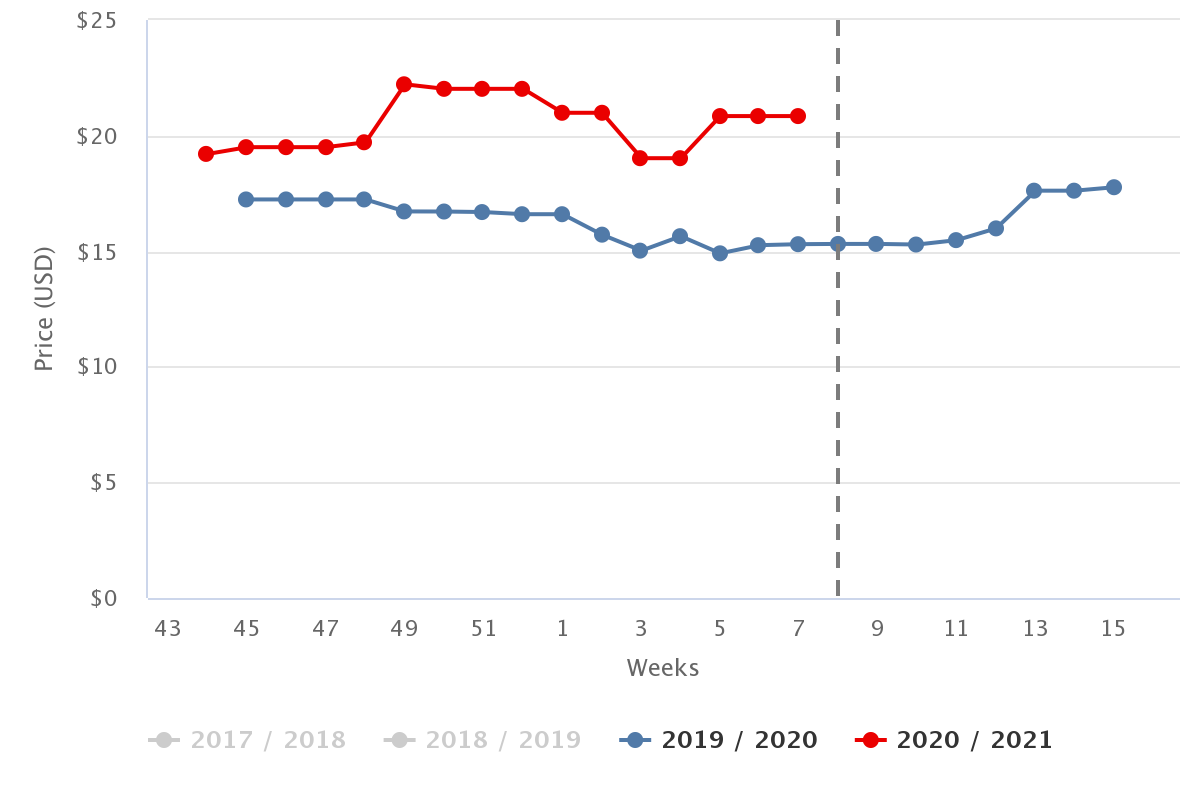
The pricing for oranges has been rather similar to grapefruits, coming in considerably higher than last year with the last report made on the Feb. 17, again indicating that volumes for the spot market are all dried up.
Oranges from Texas, Non-Organic | Prices by History (7/10 Bushel Cartons)

(Source: USDA Market News via Agronometrics. Agronometrics users can view this chart with live updates here)
Worryingly, the damage does not only extend to the rest of this season. “Most of the citrus crop in the Rio Grande Valley comes in from September through May, so we can expect little to no citrus production during the 2021-2022 season as well,” said Anciso.
In our ‘In Charts’ series, we work to tell some of the stories that are moving the industry. Feel free to take a look at the other articles by clicking here.
You can keep track of the markets daily through Agronometrics, a data visualization tool built to help the industry make sense of the huge amounts of data that professionals need to access to make informed decisions. If you found the information and the charts from this article useful, feel free to visit us at www.agronometrics.com where you can easily access these same graphs, or explore the other 20 fruits we currently track.


Subscribe to our newsletter


