


Agronometrics in Charts: Current scenario for Chilean avocados in the U.S.


In this installment of the ‘Agronometrics In Charts’ series, Cristian Crespo illustrates how the U.S. market is evolving. Each week the series looks at a different horticultural commodity, focusing on a specific origin or topic visualizing the market factors that are driving change.


Exports of Chilean avocados in 2019 reached their highest level in the last 10 years. The opening of new markets, like South Korea, along with the increase to other destinations like Japan, China and some European countries, has been the main driver of this rise. However, the U.S. market tells a very different story, with Chilean avocado volumes at their lowest level in recent years.
An interesting aspect has been the flexibility of Chile to change markets when the U.S. prices are low. That speaks to the resilience of the country as a producer and the ability to supply the U.S. in the future if that is required.
Looking at the numbers, 2020 saw the lowest volumes from Chile in recent years in the U.S. market, with the South American country exporting 93 percent less than in the previous year. Supplies are concentrated from weeks 37 to 44, as can be seen in the chart below.
Historical volume of Chilean avocados in the U.S. market (KG)

(Source: USDA Market News via Agronometrics. Agronometrics users can view this chart with live updates here)
The current U.S. avocado market is dominated by volumes from Mexico, with other supplies from California, Peru, and Colombia.
Volumes of avocados in the U.S. market (KG)

(Source: USDA Market News via Agronometrics. Agronometrics users can view this chart with live updates here)
It's interesting to note how Chile's volumes have been declining while Peru's have been rising, as can be seen below. This is due to a production advantage. Chile comes in at the same time as Mexico, while Peru comes in with California and therefore better prices.
Historical volumes of avocados from Chile and Peru in the U.S.

(Source: USDA Market News via Agronometrics. Agronometrics users can view this chart with live updates here)
In terms of prices, we can see that they have remained largely stable over the years, despite the sustained increase in volume since 2020.
Historical prices (USD/KG) and volume (KG) of avocados in the U.S. market
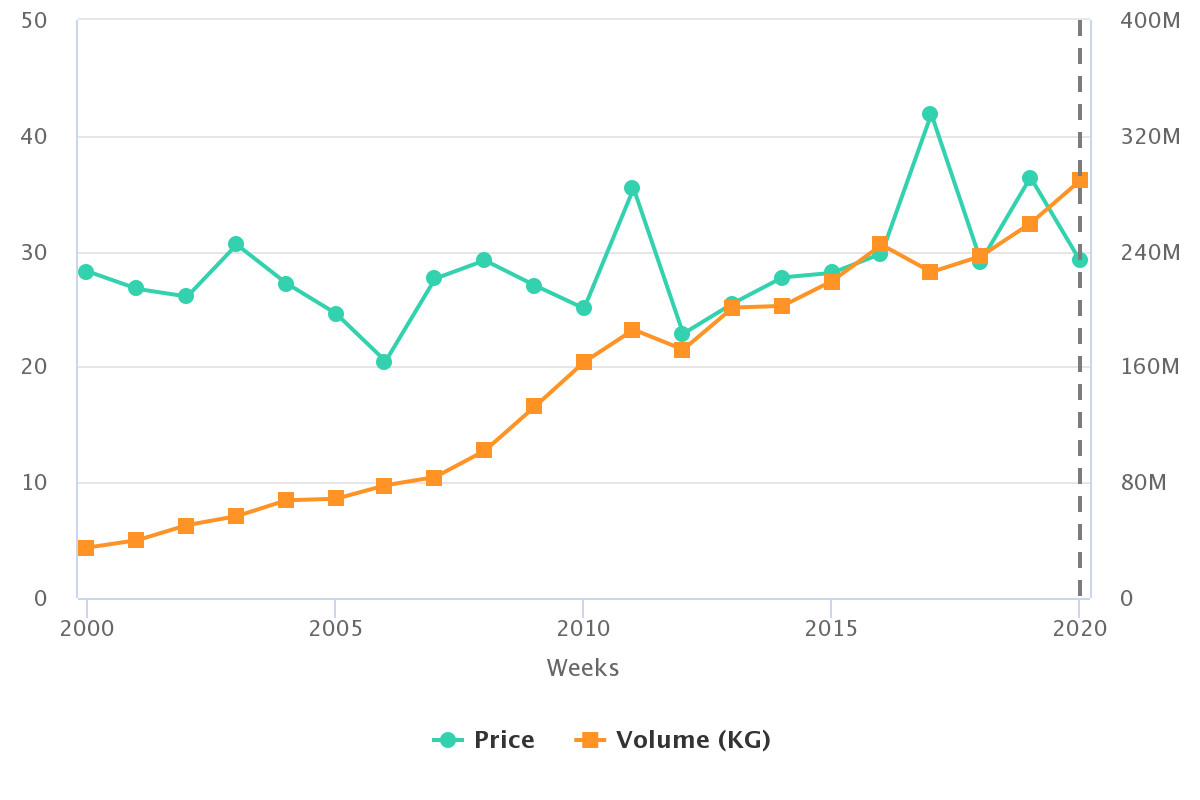
(Source: USDA Market News via Agronometrics. Agronometrics users can view this chart with live updates here)
For now, the U.S. market doesn't appear to be the most attractive for Chilean exports, but Chile has the capacity to produce and send large volumes to the U.S. market if conditions allow. In the end, the market will have the final say.
In our ‘In Charts’ series, we work to tell some of the stories that are moving the industry. Feel free to take a look at the other articles by clicking here.
You can keep track of the markets daily through Agronometrics, a data visualization tool built to help the industry make sense of the huge amounts of data that professionals need to access to make informed decisions. If you found the information and the charts from this article useful, feel free to visit us at www.agronometrics.com where you can easily access these same graphs, or explore the other 20 fruits we currently track.


Subscribe to our newsletter


