


Agronometrics in Charts: Berry prices see magnificent growth year-on-year in U.S. market


In this installment of the ‘In Charts' series, Cristian Crespo of Agronometrics illustrates how the U.S. market is evolving. Each week the series looks at a different horticultural commodity, focusing on a specific origin or topic visualizing the market factors that are driving change.


In this week's "In Charts" we will be taking a look at how volumes and average prices of blueberries, raspberries, strawberries and blackberries in the U.S. market in comparison to previous years.
Overall we can conclude that these four types of berries have seen higher prices, over 50%, than in previous seasons for the same date range.
We are constantly updating berry prices in the North American market and you can find more information here.
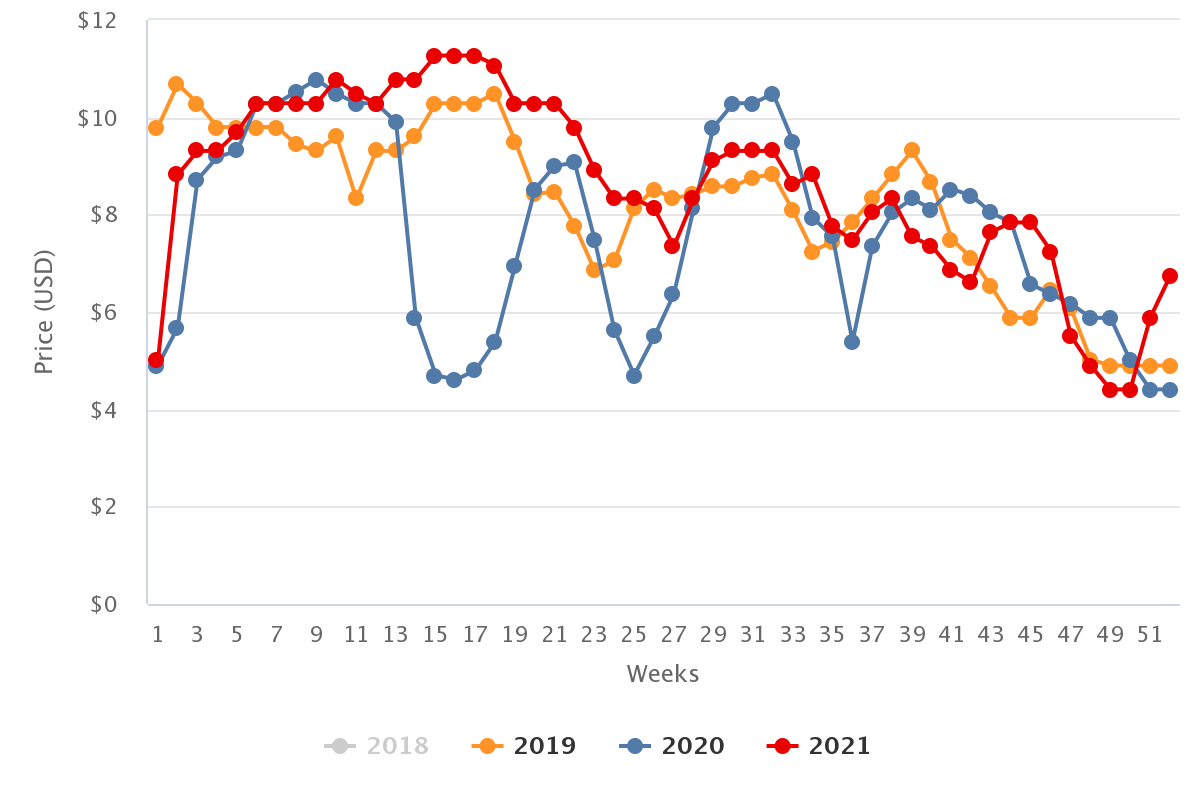
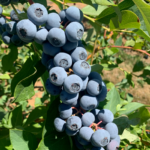
Blueberries
Regarding blueberry prices, we can say that over the last weeks of 2021 they increased significantly.
If we look at the graph below, we can see that in week 52 of 2021, the average price of conventional blueberries was US$6.91 per kilogram, a 45 percent increase year-on-year.
The prices that are being recorded are those coming from Mexico and Peru.
Conventional blueberry prices in the U.S. market (USD/KG)

(Source: USDA Market News via Agronometrics) [Agronometrics users can view this chart with live updates here]
Blueberry volumes during the last weeks of 2021 were lower in comparison to the previous season, which may have pushed the fruit's prices up in the North American market.
Raspberries
Continuing with raspberries, week 52's prices showed a significant increase compared to the previous season in the same date range.
The graph below shows that in week 52 of 2021, the average price of conventional raspberries was $6.74 per kilogram, 53 percent higher year-on-year. The prices being recorded are from Mexico.
Conventional raspberry prices in the U.S. market (USD/KG)
(Source: USDA Market News via Agronometrics) [Agronometrics users can view this chart with live updates here]
Raspberry volumes were higher year-on-year during weeks 48 and 52 of 2021, however, last week's prices showed a significant increase.
Strawberries
The prices of conventional strawberries in the U.S. market were higher between weeks 43 to 52 of 2021 and although they have fallen a bit since week 46, they are still above those of 2020.
Looking at the graph below, we can see that in week 52 the average price of conventional strawberries was $4.75 per kilogram, a 57 percent increase year-on-year.
Prices in the North American market are being registered from California, Florida and Mexico.
Conventional strawberry prices in the U.S. market (USD/KG)

(Source: USDA Market News via Agronometrics) [Agronometrics users can view this chart with live updates here]
Strawberry volumes have been similar year-on-year with a slight increase between weeks 48 and 52. Despite this, prices in the North American market continue to be higher than those of 2020 in the same date range.
Blackberries
The prices of blackberries this season in the last four weeks of 2021 were higher than those of 2020, with a considerable increase in week 52.
In the graph below we see that in week 52 the average price of conventional blackberries was $5.29 per kilogram, a 54 percent increase year-on-year. The prices that have been recorded are from Central America and Mexico.
Conventional blackberry prices in the U.S. market (USD/KG)

(Source: USDA Market News via Agronometrics) [Agronometrics users can view this chart with live updates here]
Blackberry volumes were higher year-on-year from week 45 of 2021 just as strawberries were, though prices have been higher than those of 2020.
In our ‘In Charts’ series, we work to tell some of the stories that are moving the industry. Feel free to take a look at the other articles by clicking here.
You can keep track of the markets daily through Agronometrics, a data visualization tool built to help the industry make sense of the huge amounts of data that professionals need to access to make informed decisions. If you found the information and the charts from this article useful, feel free to visit us at www.agronometrics.com where you can easily access these same graphs, or explore the other 20 fruits we currently track.


Subscribe to our newsletter


