

In this installment of the ‘Agronometrics In Charts’ series, Sarah Ilyas deconstructs the specifics of the Peruvian grape season. Each week the series looks at a different horticultural commodity, focusing on a specific origin or topic visualizing the market factors that are driving change.
The Peruvian grape season kicked off in October with a hike in exports of up to 7.4 percent compared to the last season.
The last five years saw a substantial growth in imports, with incoming volumes almost doubling in value from September 2015 to September 2021.
As exhibited by the graph below, the peak incoming volume was recorded at 256 M kg in 2021. For the remainder of the season, the USDA projects that Peru’s grape exports will plateau at a record of 510,000 metric tons.
 Source: USDA Market News via Agronometrics. (Agronometrics users can view this chart with live updates here)
Favorable weather, ample availability of water and a proliferating demand have contributed to a surge in imported volumes.
Peru has also initiated the consolidation of trade agreements in collaboration with the National Agrarian Health Service of Peru (Senasa) to access more markets.
Additionally, owing to about 12 hours of sun per day in grape fields and adequate irrigation, Peruvian grape farmers can mature grape vines about 55% faster in comparison to other countries.
The total Peruvian grape area cultivated now culminates at 79,000 acres, according to the USDA. The red globe variety mostly dominates production. Recently, however, Peruvian farmers have developed a predilection for seedless varieties.
The Peruvian grape harvest season commences in late October and ends in April. As can be observed in the graph below, a steep increase in incoming volume was recorded following week 51 of the last year.
The highest volume recorded was 20.6 M kg in week 2. Last season saw incoming volumes peaking at around 24.6 M kg.
Grape exports to the U.S. from Peru typically peak between December and January and therefore a surge in Peruvian grape volumes can be expected in the following weeks.
With the viability of grape farming in Peru improving, cumulative volumes larger than that of the previous season could be expected.

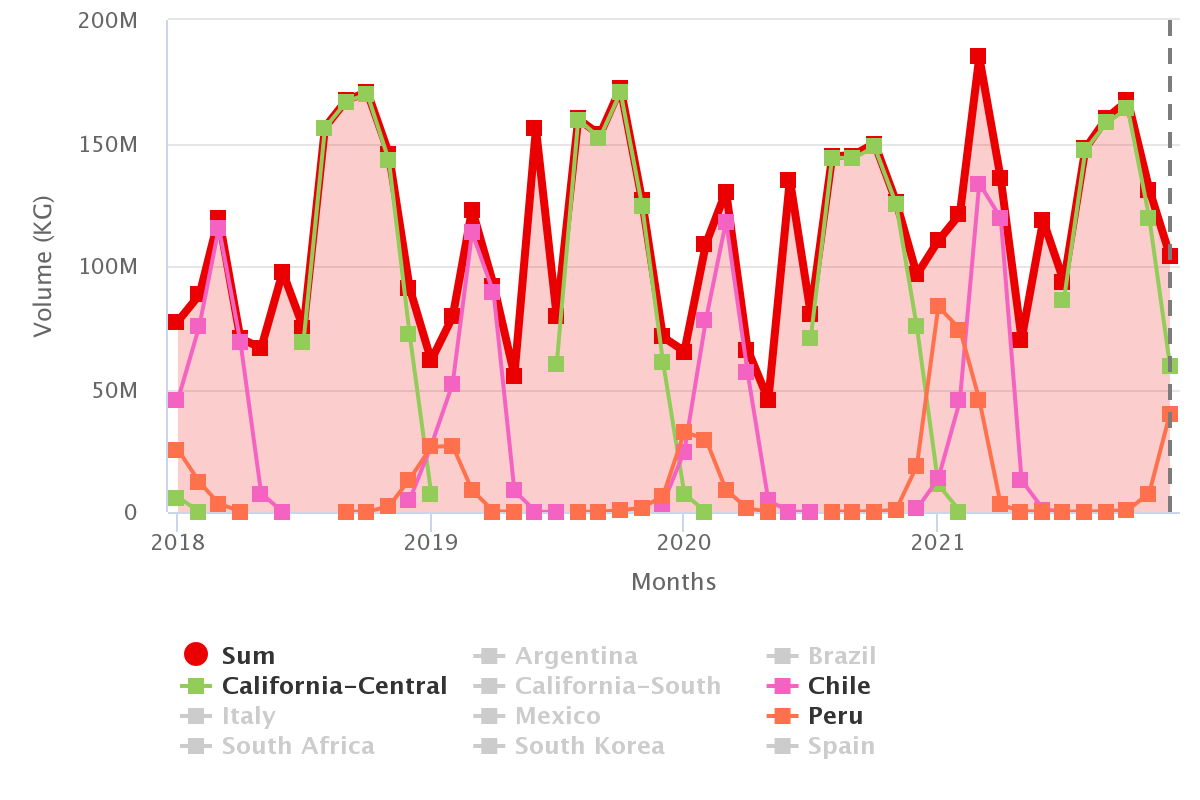
Peru picks up from the end of the Californian grape season, around September each year and dominates until April, while produce continues to trickle in until May, as shown by the graph below.
Peak volumes are recorded mostly in January, two months prior to the peak of the Chilean grape season, in March. The highest recorded volume for Peruvian grapes last season was 83M kilos.
The graph below portrays the monthly price ranges for grapes from California, Chile and Peru.
As can be observed, Peruvian grape prices are mostly at par with the prices for Chilean grapes following the end of the Californian grape season each year, illustrating the inherent value of Peruvian grapes.

The graph below compares the recorded prices for Peruvian grapes in the current and the last season.
As is evident from the numbers, the current season saw higher prices for Peruvian grapes in comparison to the last season.
The recorded prices reached a pinnacle in the first week of the year at $31.80, an increase of about 35 percent in comparison to the first week of the last year. Prices are likely to drop as the incoming volumes continue to soar.

The Philadelphia-Camden region has traditionally been the largest market for Peruvian grapes.
The graph below encapsulates the US market data for Peruvian grapes. As can be observed, this year marked a sharp increase in the imported volume of Peruvian grapes in the Philadelphia-Camden area.
This region was followed by Los Angeles – Long beach and Savannah as the largest ports of call.

Intrinsically, grapes incur exorbitantly high costs for installation, second only to blueberries. One hectare of grapes in Peru requires an initial investment of approximately USD $45,000.
Nevertheless, the return on investment for producing high value varieties can offer substantial returns.
As a labor intensive and high maintenance crop, the grape industry plays a major role in employment for Peru’s agricultural sector.
Additionally, ample availability of amenities such as water, favorable weather and an ever increasing demand for Peruvian grapes give Peru an esteemed status on the world stage for grape exports.
In our ‘In Charts’ series, we work to tell some of the stories that are moving the industry. Feel free to take a look at the other articles by clicking here.
All pricing for domestic US produce represents the spot market at Shipping Point (i.e. packing house/climate controlled warehouse, etc.). For imported fruit, the pricing data represents the spot market at Port of Entry.
You can keep track of the markets daily through Agronometrics, a data visualization tool built to help the industry make sense of the huge amounts of data that professionals need to access to make informed decisions. If you found the information and the charts from this article useful, feel free to visit us at www.agronometrics.com where you can easily access these same graphs, or explore the other 21 commodities we currently track.