

Agronometrics in Charts: Northwest sees smallest cherry crop in nearly a decade


In this installment of the ‘Agronometrics In Charts’ series, Sarah Ilyas studies the state of the Washington cherry season. Each week the series looks at a different horticultural commodity, focusing on a specific origin or topic visualizing the market factors that are driving change.


Cherry growers in Washington state, who produce the majority of Northwest sweet cherries, often have to deal with adverse weather conditions — frost during the early months of 2020 or sweltering heat in late June last year that damaged ripening fruit.
This year, the cold and wet spring stunted the development of many cherries, leading to what looks to be the smallest crop of Northwest sweet cherries in nearly a decade.
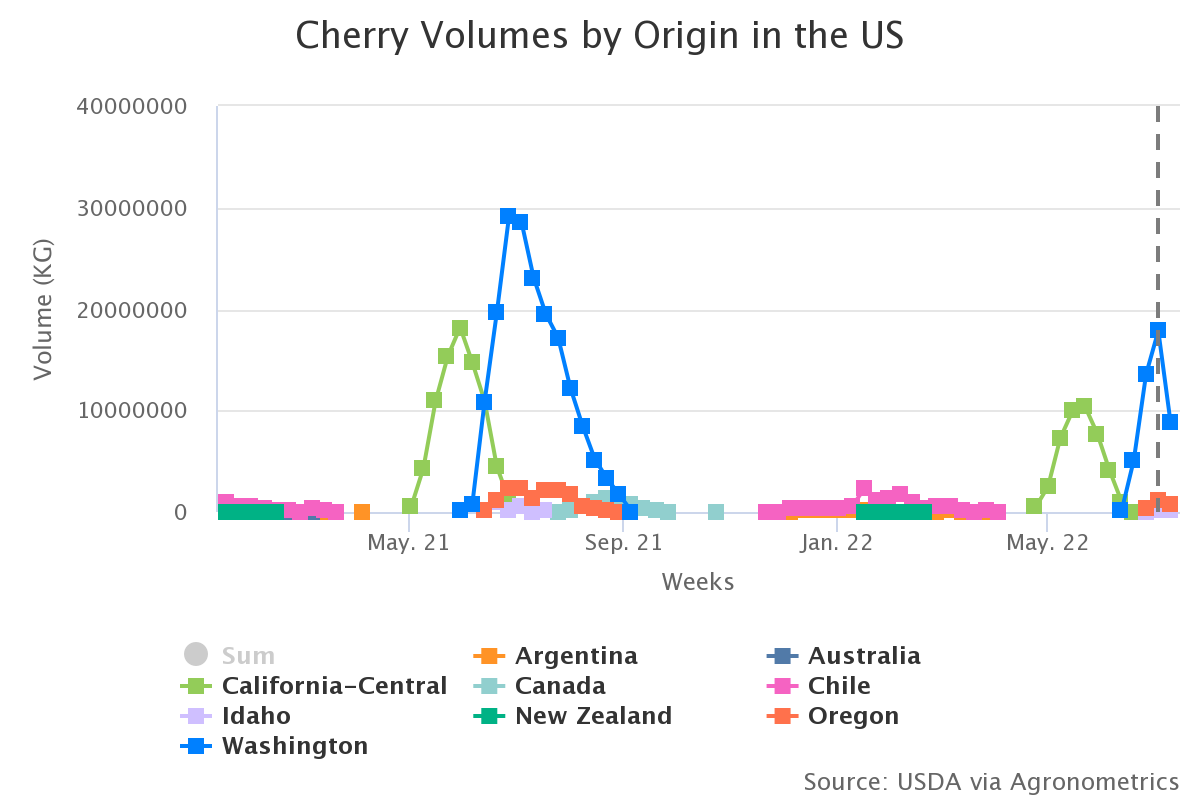
Week 27 saw a total incoming volume of 8.8 K tonnes, a 65 percent drop compared to week 27 of 2021 that saw a total volume of 23 K tonnes coming in.

(Source: USDA Market News via Agronometrics. Agronometrics users can view this chart with live updates here)
That will likely mean higher prices at local stores and markets. Additionally, with cherries taking longer to develop, harvest has been delayed by several weeks, implying that consumers in the Northwest and throughout the U.S. have to wait longer to get their hands on the juicy red fruit.
Nearly 15 million 20-pound boxes are expected to come from growers in Washington, Oregon, Idaho, Utah and Montana, according to the latest estimate of the Northwest Cherry Growers, the Yakima-based marketing organization.
If the estimate sticks, that would be nearly a quarter less than the 20.3 million boxes harvested a year ago and the smallest crop since 2013, when the region produced just 14.3 million boxes. Week 26 saw prices at $76.78 per package while week 27’s prices stood at $70.13 per package.

(Source: USDA Market News via Agronometrics. Agronometrics users can view this chart with live updates here)
(Source: USDA Market News via Agronometrics. Agronometrics users can view this chart with live updates here)
In our ‘In Charts’ series, we work to tell some of the stories that are moving the industry. Feel free to take a look at the other articles by clicking here.
All pricing for domestic US produce represents the spot market at Shipping Point (i.e. packing house/climate controlled warehouse, etc.). For imported fruit, the pricing data represents the spot market at Port of Entry.
You can keep track of the markets daily through Agronometrics, a data visualization tool built to help the industry make sense of the huge amounts of data that professionals need to access to make informed decisions. If you found the information and the charts from this article useful, feel free to visit us at www.agronometrics.com where you can easily access these same graphs, or explore the other 21 commodities we currently track.


Subscribe to our newsletter