


Agronometrics in Charts: New Peruvian mango plantations soon to enter production


In this installment of the ‘Agronometrics In Charts’ series, Sarah Ilyas studies the state of the Peruvian mango season. Each week the series looks at a different horticultural commodity, focusing on a specific origin or topic visualizing the market factors that are driving change.


According to SENASA, Peru exported 241,556 MT of fresh mangoes for the 2021/22 season to 32 different countries.
A handful of large companies added around 700 new hectares of mango plantations a few years ago in the Olmos Valley (Lambayeque). These plantations are expected to mature and enter production in the 2022-23 campaign.
After Piura, Lambayeque is Peru's second-largest mango production area. Lambayeque has pegged itself as the third-largest exporter of mango in recent years and exported 232,683 tons of mango in the 2020-21 campaign.
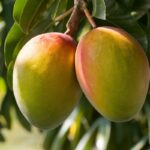
According to records of the National Agrarian Health Service (Senasa), there were more than 3,100 producers of family organic mango agriculture in Lambayeque, which are located in the areas of Motupe, Olmos, Jayanca, and Olmos Irrigation Project. Kent is the most cultivated variety in Peru and is relished for its fibreless, sweet, juicy flesh.

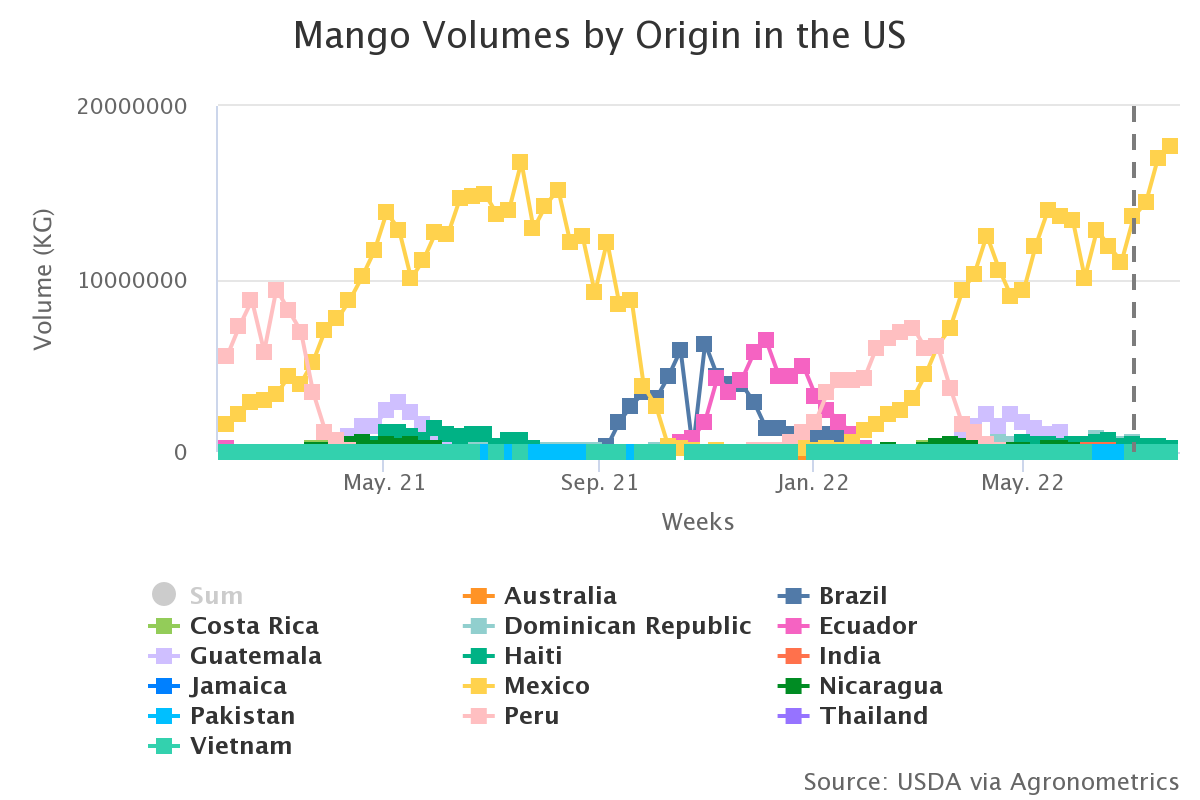
Source: USDA Market News via Agronometrics. (Agronometrics users can view this chart with live updates here)
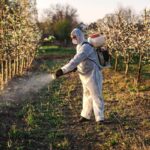
70 percent of the Peruvian mango production lies in the hands of small and medium-sized farmers who have to cope with the high price of urea and as a result, producers, especially from Piura, are willing to reduce the number of fertilizers they use or not apply them at all.
According to the National Agrarian Health Service (Senasa), 80 percent of the 5,780 small producers that are integrated into the mango export chain own less than five hectares.
The flowering stage, which is the ideal phase for the application of fertilizers that ensure the fruit has the quality and appropriate size for the next campaign (which begins in November), is near. Fertilizers, however, are scarce and producers are concerned about the high trending costs of inputs. The scarcity of fertilizers is likely to impact production.
According to Juan Carlos Rivera, general manager of the Peruvian Association of Mango Producers and Exporters (APEM), the degree to which the shortage of fertilizer will impact production will be evident in November.

Source: USDA Market News via Agronometrics. (Agronometrics users can view this chart with live updates here)
Source: USDA Market News via Agronometrics. (Agronometrics users can view this chart with live updates here)
According to the USDA, Peru’s fruit exports have escalated during the last decade, rising from just $540 million in 2010 to $3.8 billion in 2020, with Peru ranking in the world’s top 10 fruit exporting countries since 2017.
The harvest is concentrated between December and March, with competitors Brazil, Mexico, and Thailand largely shipping before or after this period.
The main varieties grown include Kent, Haden, and Tommy Atkins, which have favorable characteristics for export markets.
Source: USDA Market News via Agronometrics. (Agronometrics users can view this chart with live updates here)
In our ‘In Charts’ series, we work to tell some of the stories that are moving the industry. Feel free to take a look at the other articles by clicking here.
All pricing for domestic US produce represents the spot market at Shipping Point (i.e. packing house/climate controlled warehouse, etc.). For imported fruit, the pricing data represents the spot market at Port of Entry.
You can keep track of the markets daily through Agronometrics, a data visualization tool built to help the industry make sense of the huge amounts of data that professionals need to access to make informed decisions.
If you found the information and the charts from this article useful, feel free to visit us at www.agronometrics.com where you can easily access these same graphs, or explore the other 21 commodities we currently track.


Subscribe to our newsletter


