


Agronometrics in Charts: Mexican organic blueberries gaining popularity slowly but steadily


In this installment of the ‘Agronometrics In Charts’ series, Sarah Ilyas studies the state of the Mexican blueberry season. Each week the series looks at a different horticultural commodity, focusing on a specific origin or topic visualizing the market factors that are driving change.


The Mexican blueberry crop has displayed tremendous growth in recent years, both in terms of growing area and in terms of production. Around 90% of the area is concentrated in three states: Jalisco, Michoacán and Sinaloa. Organic production is becoming increasingly relevant globally, with 15 percent of the blueberry area in Mexico currently producing organically.
The harvest window spans a large part of the year, with volumes culminating during the months of December, April and June and the lowest volumes being recorded between August and October.
Blueberry production reaches its nadir at the beginning of the year, with a modest increase in April a first peak in June, and then drops to its lowest levels between August and October. Thereafter, it increases again until reaching its maximum peak in December. Currently, about 97 percent of production is exported to 31 destinations with the main market being the U.S.
Volumes of Mexican blueberry this season, in week 36 stood at approximately 140 tonnes, displaying a 24 percent increase compared to the same period in the previous season.
The last season saw volumes peaking at 4.8 K tonnes. Volumes this season will largely depend on weather viability and the extent to which challenges such as labor shortages, water shortages and phytosanitary problems impact the industry.
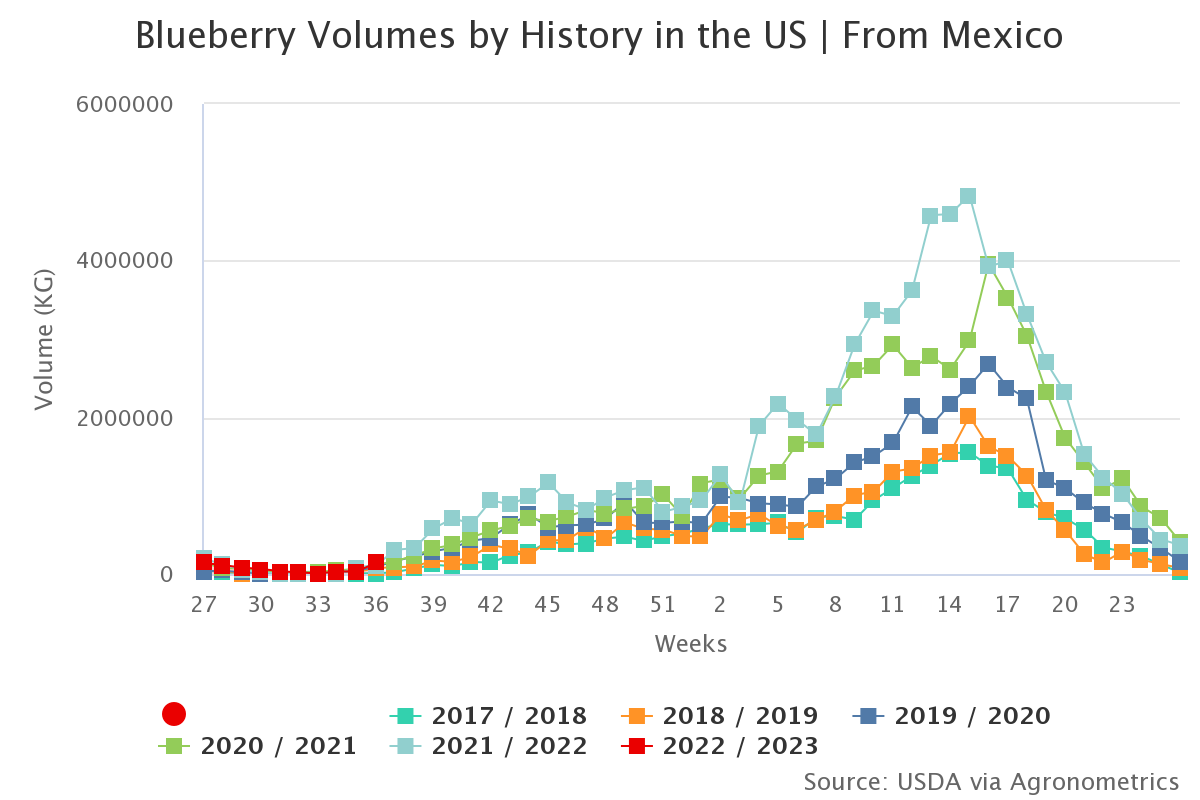
(Source: USDA Market News via Agronometrics. Agronometrics users can view this chart with live updates here)
Generally, when higher volumes from Peru, Chile and the U.S. arrive, prices tend to drop. Pricing this season has been highly variable with prices decreasing by roughly 44 percent between weeks 29 and 32. Week 36 saw prices at $20.89 per package, having dropped by roughly 20 percent compared to the previous season.
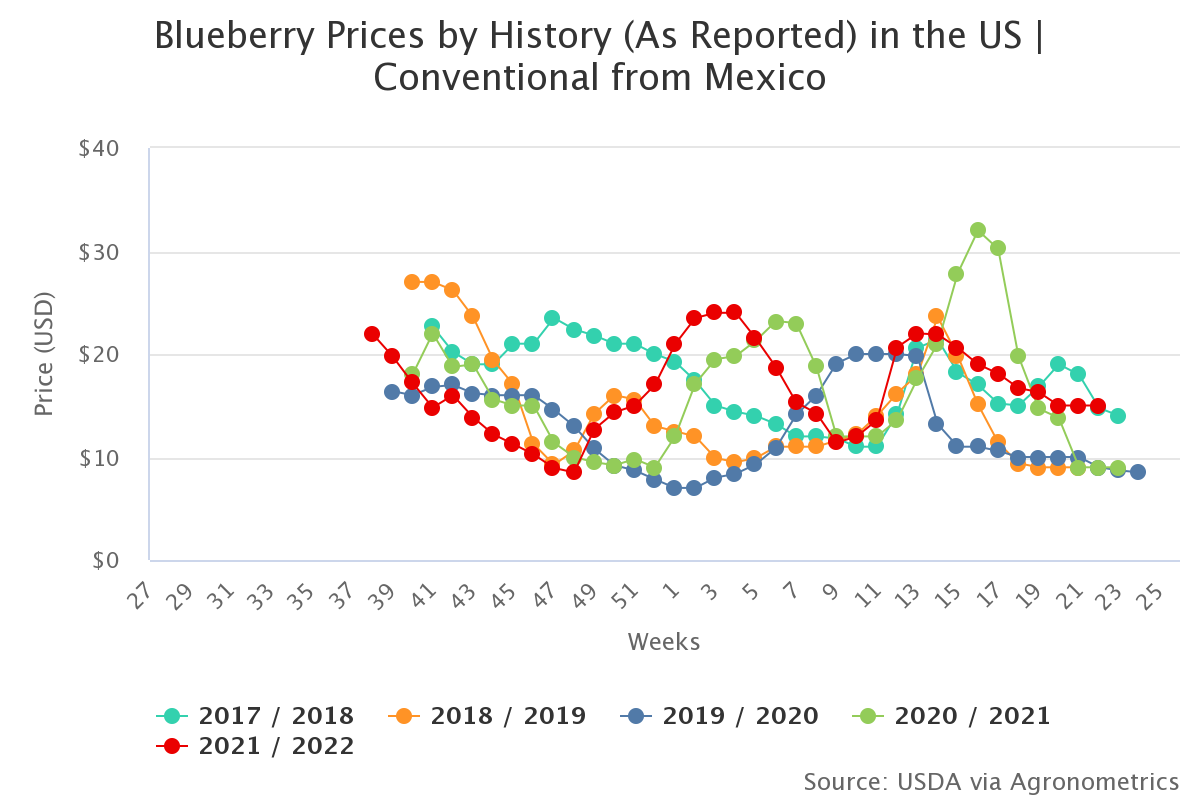
(Source: USDA Market News via Agronometrics. Agronometrics users can view this chart with live updates here)
In Mexico, 18% of the production is currently dedicated to organic blueberries, so there is an opportunity of growth for those farmers who want to work under an organic production system as consumers become more aware of the health benefits of consuming organic blueberries.
Mexico has the potential for sustained growth; it can avail windows during the year that are not being fully exploited currently. Apart from initiating exports to more countries, it can work to extend exports until the summer, since these witness drastic drops during the months of June, July and August.

(Source: USDA Market News via Agronometrics. Agronometrics users can view this chart with live updates here)
In our ‘In Charts’ series, we work to tell some of the stories that are moving the industry. Feel free to take a look at the other articles by clicking here.
All pricing for domestic US produce represents the spot market at Shipping Point (i.e. packing house/climate controlled warehouse, etc.). For imported fruit, the pricing data represents the spot market at Port of Entry.
You can keep track of the markets daily through Agronometrics, a data visualization tool built to help the industry make sense of the huge amounts of data that professionals need to access to make informed decisions. If you found the information and the charts from this article useful, feel free to visit us at www.agronometrics.com where you can easily access these same graphs, or explore the other 21 commodities we currently track.


Subscribe to our newsletter


