


Grapes in Charts: Mexico helps make America grape again


In this week's ‘In Charts' installment, Luis Aragón of data visualization tool Agronometrics illustrates how the U.S. market is evolving. Each week the article will look at a different horticultural commodity, focusing on a specific origin or topic to see what factors are driving change.


A rapid glance at the chart below illustrates how U.S. shipments for table grapes - of all varieties - are essentially made up by five origins: Chile, Mexico, Peru, and California (Central + Southern). Each of which essentially drives the bulk of supply during their respective seasons.
Grapes, Non-Organic, Historic Weekly Shipments
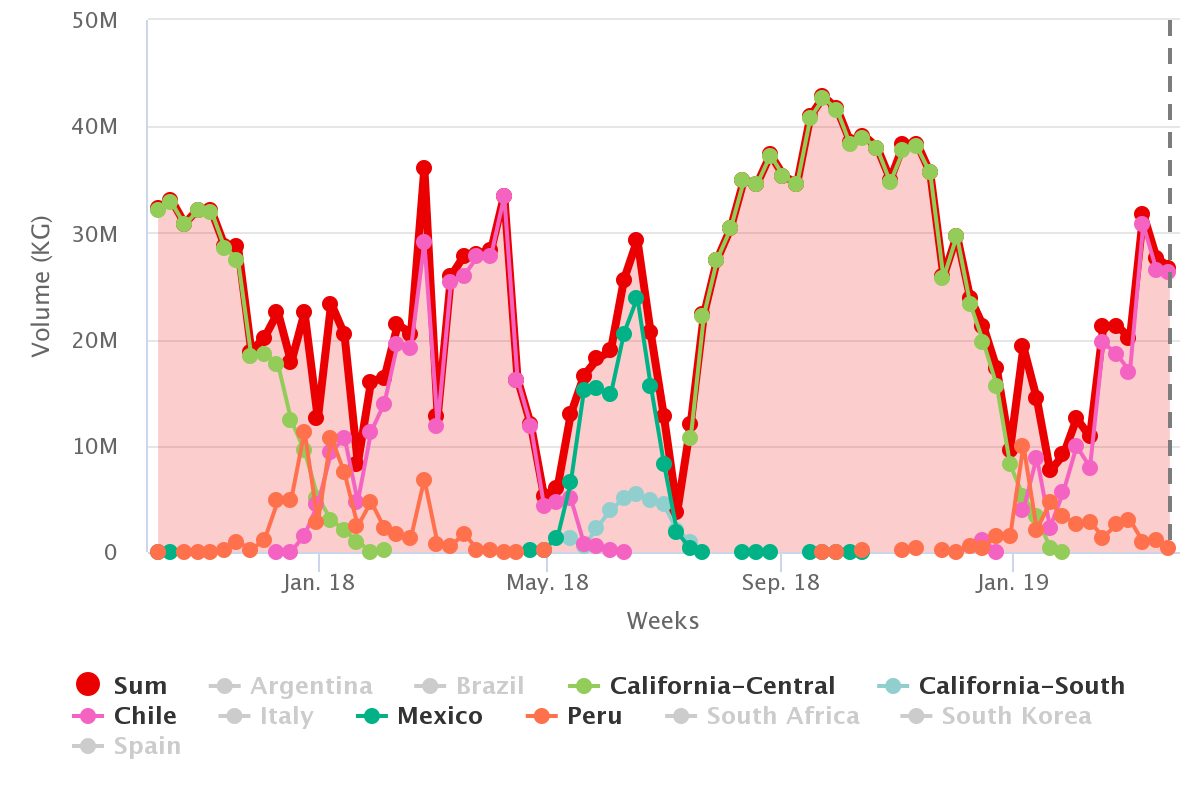
(Source: USDA Market News via Agronometrics)
[Agronometrics users can view this chart with live updates here]
A dive into 2018 data reveals that Chile was the top foreign supplier of grapes to the U.S., accounting for roughly 64.6% of total import volume. In second place we see Mexico with 25.2%, followed distantly in third by Peru at 9.3%
Today, we find ourselves at a point where Chile’s season is going to significantly wind down and Mexico’s harvests will soon start hitting the markets. The question is, how significant will this time gap be?
Additionally, when we listen to what is being said about volumes, we see the discussion takes an even more interesting turn.
As explained in detail on the recent FreshFruitPortal.com article entitled “Massive Mexican table grape crop on the cards”, expected shipments are said to be on track to approach 2017’s figures. This is attributed in some measure to the grape producers’ association of Mexican State of Sonora (bordering Arizona), which during its first-ever summit hosted in the U.S. spoke some eyebrow-raising volumes.
The final total export tally from Sonora for 2018 was 16.37 million 19-pound boxes. In contrast, the association foresees some 22 million boxes destined for crop exports this year, which would represent 25% increment.
Origin: Mexico, Grapes, Non-Organic, Historic Weekly Shipments

(Source: USDA Market News via Agronometrics)
[Agronometrics users can view this chart with live updates here]
Given the high number of varieties, a quick breakdown of grapes originating from Mexico is warranted. Out of the 18 different grape varieties monitored by the United States Department of Agriculture, we can identify and isolate the six main varieties originating from Mexico which are: BLACK: Summer Royal | RED: Red Globe, Flame Seedless | WHITE: White Seedless, Sugarone, Perlette.
Origin: Mexico, Grapes, Non-Organic, 6 top varieties, 2018 Weekly

(Source: USDA Market News via Agronometrics)
[Agronometrics users can view this chart with live updates here]
On the other hand, Direct Source Marketing mentions how cooler temperatures throughout the table grape growing regions of Mexico are behind the expectations of a 10 to 14-day delay in harvest schedules. This hints at the possibility of rather high spot prices during April and May, as the market looks to stretch out Chilean supplies until it starts raining grapes from Mexico. Recall that around 70% of the Mexican volumes are shipped during June and early July.
Over the past six weeks, price behavior indicates a slight downward trend, whereby average prices slid from US$23.82 down to US$19.97, as Chilean shipments increased from 21.33M to 26.75M for this time period.
Grapes, Non-Organic, by Variety, Historic Daily Prices

(Source: USDA Market News via Agronometrics)
[Agronometrics users can view this chart with live updates here]
Notwithstanding, when we zoom out and look at historic price fluctuations over the past four years, we observe how we are in the middle of the price saddle, and a rather steep price climb is bound to begin at any moment now.
Grapes, Non-Organic, Historic Weekly Prices

(Source: USDA Market News via Agronometrics)
[Agronometrics users can view this chart with live updates here]
So as the U.S. market is set to start its seasonal price climb at any instant, and with its southern neighbor heralding a massive amount of product over the horizon, we ought to be paying very close attention to supply, as well as effective availability. Volatile spikes seem to on the menu because as the saying goes: timing is everything. But then again, people also say there is never a perfect time for anything…
In our ‘In Charts’ series, we work to tell some of the stories that are moving the industry. Feel free to take a look at the other articles by clicking here.
You can keep track of the markets daily through Agronometrics, a data visualization tool built to help the industry make sense of the huge amounts of data that professionals need to access to make informed decisions. If you found the information and the charts from this article useful, feel free to visit us at www.agronometrics.com where you can easily access these same graphs, or explore the other 23 fruits we currently track.


Subscribe to our newsletter


