Agronometrics in Charts: The effects of Covid-19 on Florida's blueberry season


By Colin Fain of Agronometrics for the North American Blueberry Council (NABC). Originally published here on April 30, 2020


Historically the period between Chile's season and Florida’s season was characterized by low volumes and high prices. Today the landscape is very different -in the wake of unusually high pricing in February, March and April, brought on by a lack of Chilean and Mexican fruit.
However, Mexico is now reporting volumes consistently larger than last year. When combined with the tailings of Chile and Florida’s early season, week 12 (w/e Mar 22) through week 14 (w/e Apr 5) have seen more volume than we have seen in the past for this time period.
Historic Volumes | Non-Organic
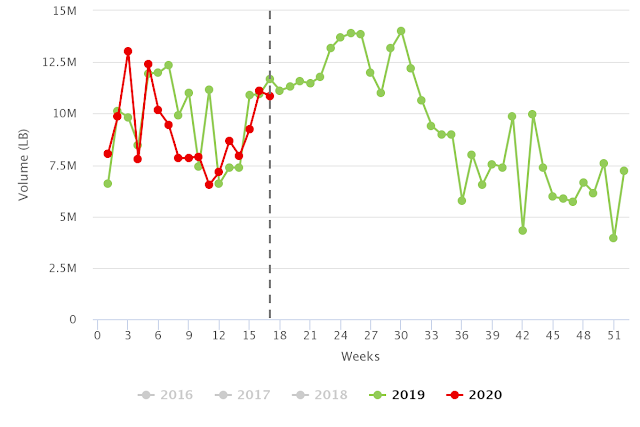
(Source: USDA Market News via Agronometrics. Agronometrics users can view this chart with live updates here)
A total increase in volume of 10% during these three weeks on last year, however, can’t explain how more than half of the value has been taken out of the market, from an average of $4.91 USD/LB on week 12 (Mar 22) to $2.35 USD/LB on week 15 (Apr 12).
Historic Prices (USD/LB) | Non-Organic

(Source: USDA Market News via Agronometrics. Agronometrics users can view this chart with live updates here)
In this case there appears to be a strong argument to be made for tying a large portion of the impact on COVID-19, which is throwing a figurative wrench into the categories supply chain. This disruption can be seen by the contrasting stories that we are hearing from different markets.
On one hand, many producers are in fear that their livelihoods are at stake, while on the other hand we are seeing reports that retail sales have never been better thanks to panic buying.
In the NABC COVID-19 email dated April 8 2020, there was a report from IRI stating that the total dollars spent on fresh berries weeks 11 (Mar 15) and 12 (Mar 22) jumped 32.5% and 23.5% respectively, coming down to an increase of 4% on week 13 (Mar 29). And similar trends have been seen across most grocery items carried by the supermarkets.
The good news is that the jump in demand is real measured and tangible, consumers haven’t lost their appetite for blueberries, and if week 13 (Mar 29) is an indicator of where the market is heading, we might expect that consumers will spend similar amounts on blueberries in the coming weeks as they were spending last year.
The bad news is that panic purchases happen much faster than supply chains can move. Few could have predicted the spike in demand would hit exactly on week 11 (Mar 15) and week 12 (Mar 22), right as Florida was ramping up two weeks ahead of where it’s season would typically start.
Historic Florida Volumes | Non-Organic

(Source: USDA Market News via Agronometrics. Agronometrics users can view this chart with live updates here)
Considering that it normally takes around two weeks for fruit to make it from handlers that report to the USDA to retail consumers, the timing of all these events suggest that when Florida’s production finally got up to full speed, the supply chain was crippled under the volume of products being demanded by the American public.
Supply chain complications in turn hampered the ability for blueberries to reach consumers on retail shelves. The effect is that the market couldn't move the volumes of fruit that were available, even as product was heavily discounted at wholesale accounting for the price drop starting on week 13 (Mar 29).
A set of factors to watch out for as we continue to deal with the fallout from the pandemic are the logistical hurdles that the industry could face. If too many pickers get sick the consequences have serious farm-level impacts, however significant numbers of sick truckers, retail staff, and warehouse workers will have a broader impact on the industry, with potentially dire consequences.
To end on a good note, though, with demand coming back to last year’s levels, as we saw in retail data on week 13 (Mar 29), the mad rush to get products to supermarkets will decrease and supply chains look to be opening up again. This is evident in the pricing we are seeing for week 16 (Apr 19) which has even seen a bit of an increase in the last couple of days. Barring any other complications, the season may yet return to some semblance of normal.
Historic Prices (USD/LB) | Non-Organic
(Source: USDA Market News via Agronometrics. Agronometrics users can view this chart with live updates here)
In our ‘In Charts’ series, we work to tell some of the stories that are moving the industry. Feel free to take a look at the other articles by clicking here.
You can keep track of the markets daily through Agronometrics, a data visualization tool built to help the industry make sense of the huge amounts of data that professionals need to access to make informed decisions. If you found the information and the charts from this article useful, feel free to visit us at www.agronometrics.com where you can easily access these same graphs, or explore the other 20 fruits we currently track.


Subscribe to our newsletter