
In this installment of the ‘In Charts' series, Cristian Crespo of Agronometrics illustrates how the U.S. market is evolving. Each week the series looks at a different horticultural commodity, focusing on a specific origin or topic visualizing the market factors that are driving change.
This week we will be taking a look to see how the average prices and volumes of grapes have behaved in the U.S. market, specifically by their origins and varieties.
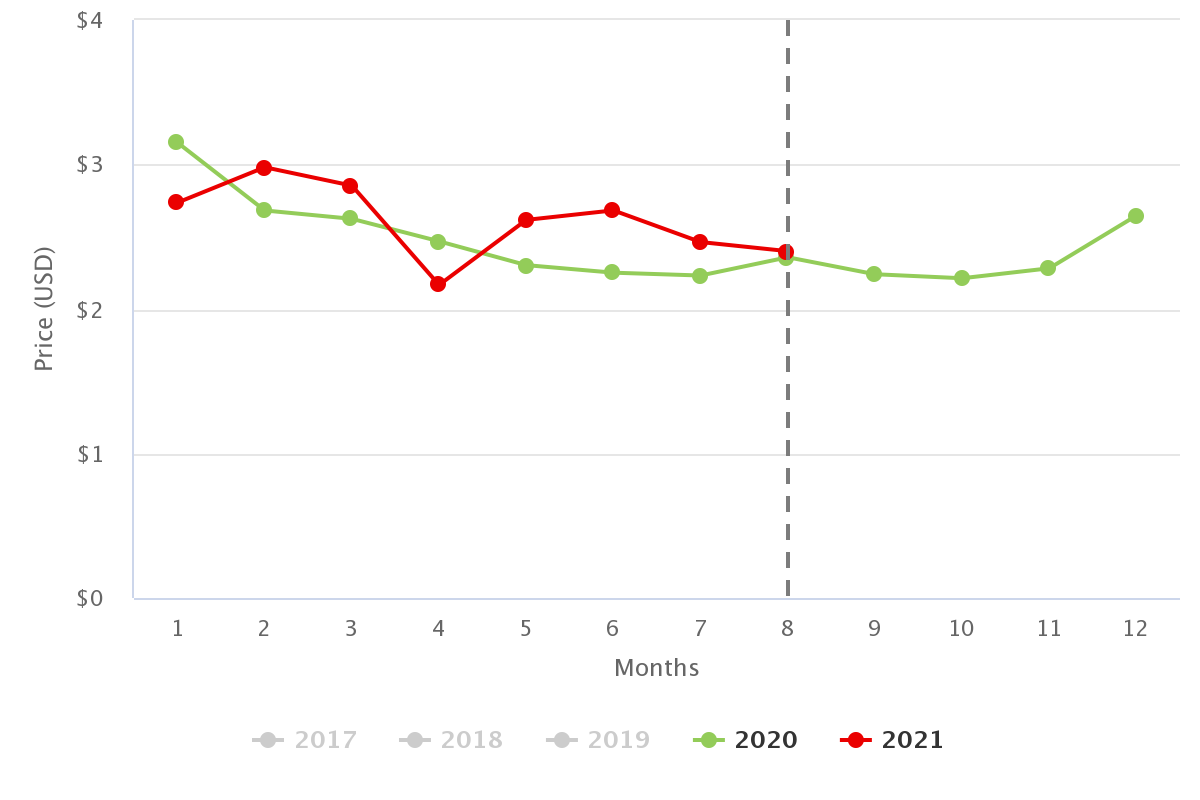
Average grape prices in the U.S. market throughout the majority of 2021 have been higher than those of 2020, with the exception of January and April. This increase took place despite the fact that grape volumes have been higher than those of previous years, as we will see later.
In the graph below we can see that the prices of conventional grapes in the month of August were US$2.40 per kilogram, a two percent increase year on year. Currently, prices of grapes are only being reported from California.
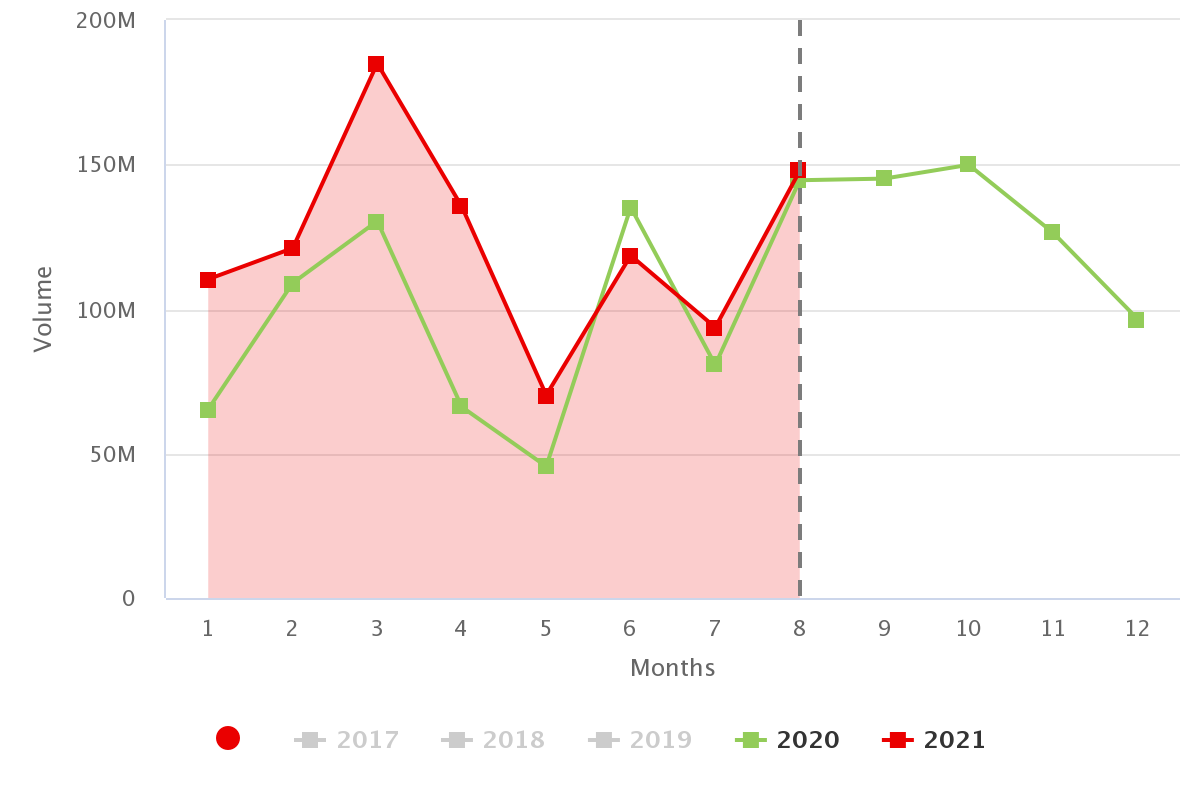
Regarding grape volumes in 2021 in the U.S. market, we can see that these have been higher than those of 2020 in the graph below. This is mainly due to the large increase in fruit from Peru in January and April as well as the increase in volumes from Chile between February and March.
Currently, grape supplies are similar to last year. In August, almost 148 million kilograms of grapes arrived in the U.S. market which is two percent higher year on year.
Looking at prices by variety, the highest average prices in the last two weeks are reported for the Sugraone variety at $2.78 per kilogram, while the lowest prices were for seedless white grapes with $2.38 per kilogram.

We will have to wait and see what happens in the future to grape prices, which will depend mainly on supplies from California, which are the only source of grape volumes until a new season begins in Peru.
In our ‘In Charts’ series, we work to tell some of the stories that are moving the industry. Feel free to take a look at the other articles by clicking here.
You can keep track of the markets daily through Agronometrics, a data visualization tool built to help the industry make sense of the huge amounts of data that professionals need to access to make informed decisions. If you found the information and the charts from this article useful, feel free to visit us at www.agronometrics.com where you can easily access these same graphs, or explore the other 20 fruits we currently track.