

In this installment of the ‘Agronometrics In Charts’ series, Sarah Ilyas studies the state of the Peruvian fresh grape season. Each week the series looks at a different horticultural commodity, focusing on a specific origin or topic visualizing the market factors that are driving change.
Peru's agricultural exports are climbing. Sales totaled US$4.293 billion in the first half of the year, an increase of 25.1% compared to the same period in 2021, according to the Ministry of Agrarian Development and Irrigation (Midagri). Grapes stood out in the agricultural-exports ranking, totaling US$595 million and accounting for 15.5% of total sales.
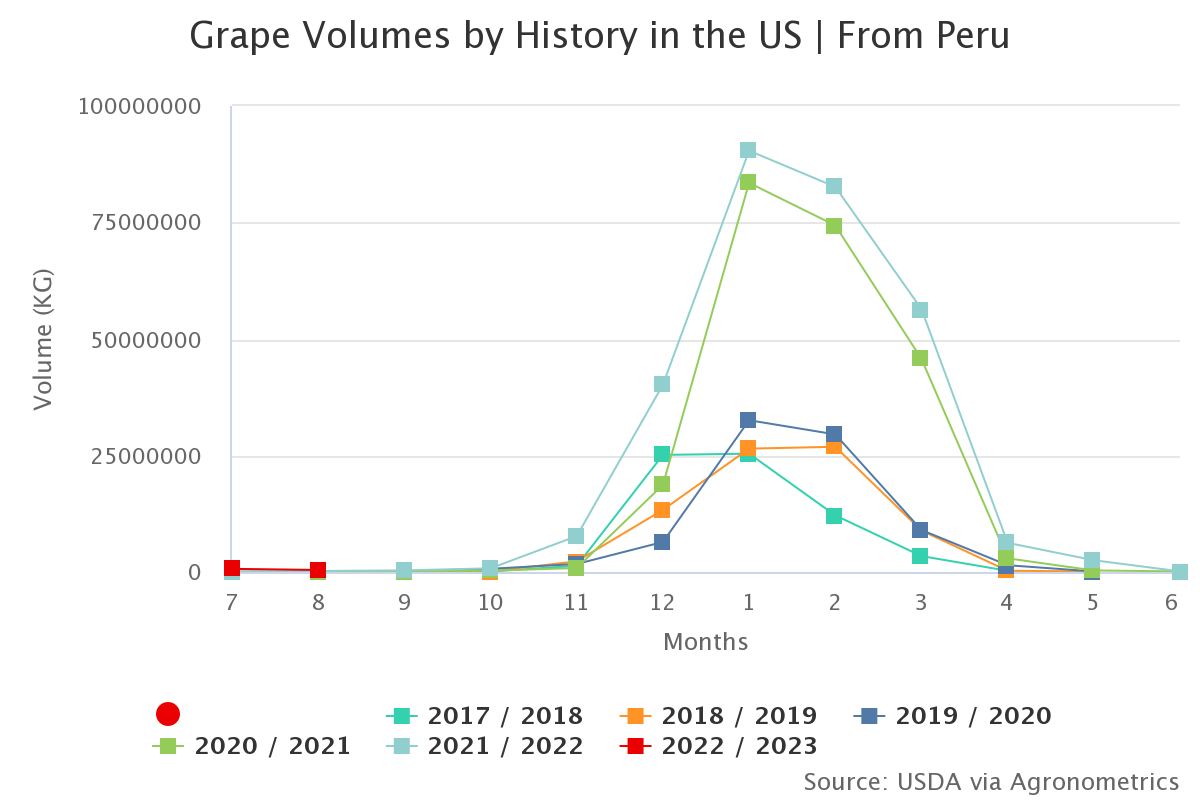
The Peruvian table grape season kicks off in October and ends in March. Expectations are high in terms of what Peru can achieve in the 2022-23 campaign.
Logistical impediments such as port delays, high freight rates and slow customs clearance, among other issues, however, are continuing to strain the supply chain.
Inflation and the strengthening U.S. dollar are adding volatility to the market. Variations in freight rates are making it challenging to make predictions on the dot.
Green seedless varieties are witnessing particularly strong demand in North America, while proprietary varieties, in general, continue to capture consumers’ interest. Customers eagerly anticipate fresh grape arrivals from Peru and a sustained growth in demand is expected.

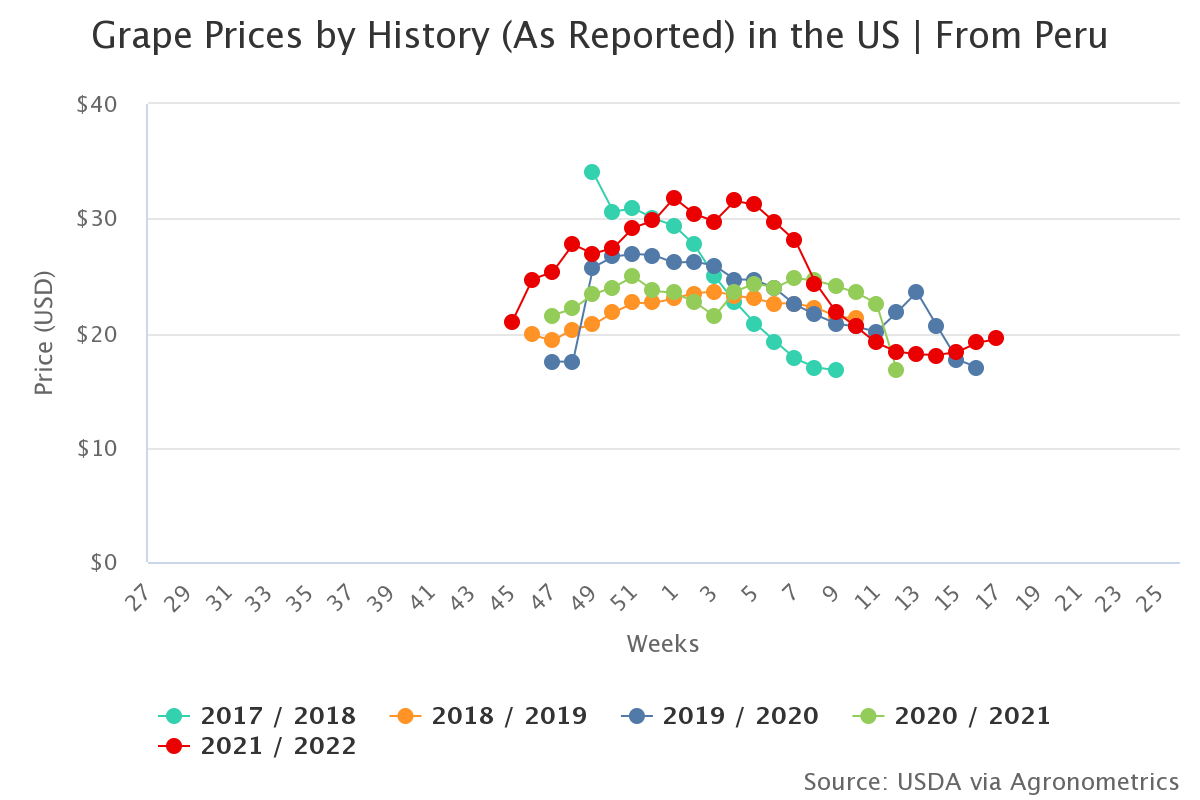
Prices in the 2021-2022 season ranged from $18.08 per package to $31.80 per package, reflecting the existing volatility in the market. Week 1 depicted a 36% increase in prices compared to the 2020-21 season.
According to the Peruvian Table Grape Growers Association (Provid), this season will exceed 64 million boxes of table grapes shipped, which represents an annual increase of 12 percent compared to the 2021-2022 season (which saw exports of up to 64.8 million boxes of 8.2 kilos per unit) and pegs it as the second largest exporter of table grapes internationally, in terms of volume.
Peru’s traditional supply window to the US spans from November to January. Demand for table grapes from Peru is soaring and therefore enlarging the supply window will enable the country to better compete with Chile and Mexico.
In our ‘In Charts’ series, we work to tell some of the stories that are moving the industry. Feel free to take a look at the other articles by clicking here.
All pricing for domestic US produce represents the spot market at Shipping Point (i.e. packing house/climate controlled warehouse, etc.). For imported fruit, the pricing data represents the spot market at Port of Entry.
You can keep track of the markets daily through Agronometrics, a data visualization tool built to help the industry make sense of the huge amounts of data that professionals need to access to make informed decisions. If you found the information and the charts from this article useful, feel free to visit us at www.agronometrics.com where you can easily access these same graphs, or explore the other 21 commodities we currently track.