


Agronometrics in Charts: Peruvian grape industry reaping benefits of varietal diversification


In this installment of the ‘Agronometrics In Charts’ series, Sarah Ilyas studies the state of the Peruvian grape season. Each week the series looks at a different horticultural commodity, focusing on a specific origin or topic visualizing the market factors that are driving change.


According to a recent news release by the Association of Table Grape Producers of Peru (PROVID), table grape exports from Peru are projected to grow by 11% in comparison to the previous campaign and the exported volumes are expected to culminate to about 71.5 million boxes (each box equalling 8.2 kilograms).
Upon evaluation of the preseason conditions in August, Fernando Cillóniz Benavides, president of the consulting firm Inform@cción concluded that the 2022-23 season will be a success, according to a report by Agraria.pe. Peru exported 64 million boxes of table grapes in the 2021-22 season, recording an increase of 13 percent compared to the 57 million boxes exported during the previous season.

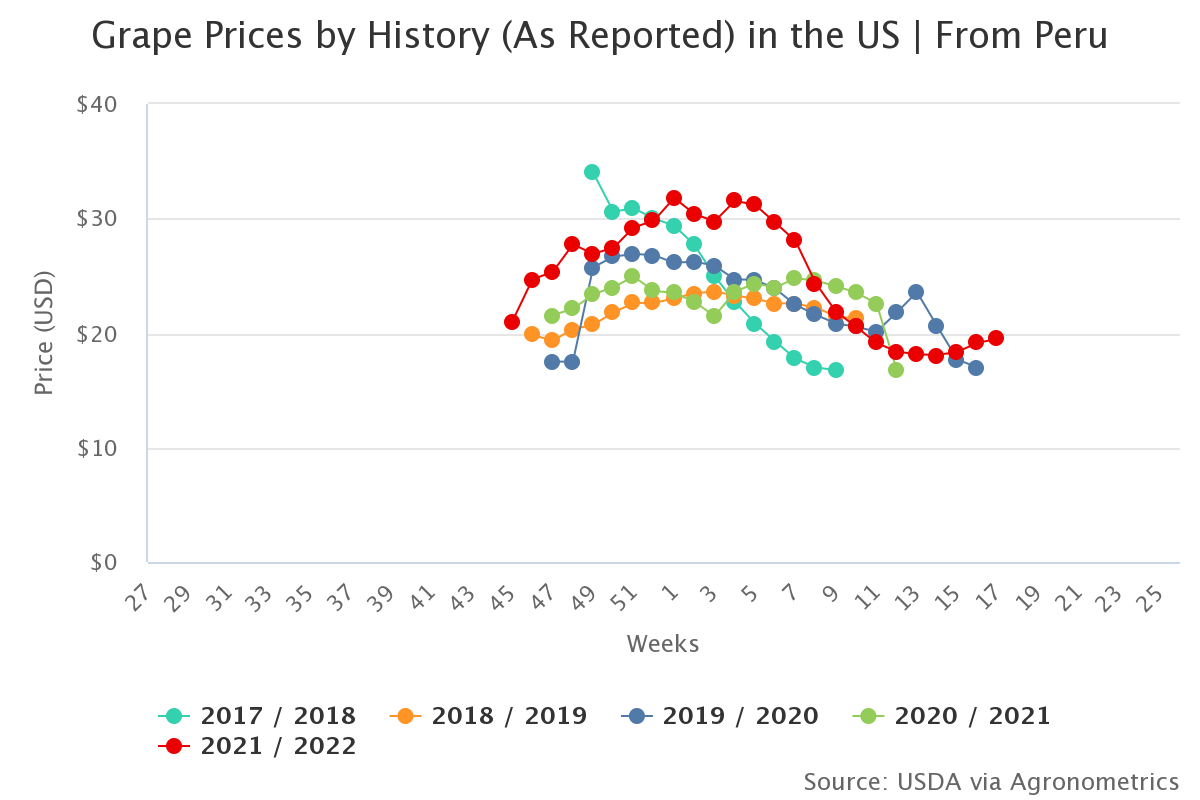
(Source: USDA Market News via Agronometrics. Agronometrics users can view this chart with live updates here)
While grappling with issues such as a lack of containers and escalating freight costs, Peru has been able to attain second place in the export of table grapes by volume.
A swift changeover in varieties has been driving demand and has enabled the diversification of markets. Additionally, extension of its production window has contributed to the country’s meteoric success.
Production usually begins with the Red globe in June and extends until March, spanning almost the entire year. In Piura, seedless grapes production is initiated in September along the Peruvian coast until March, volumes mostly culminate in in April.

(Source: USDA Market News via Agronometrics. Agronometrics users can view this chart with live updates here)
In the previous season, White seedless accounted for 42 percent of exports, up 37 percent from the previous season, followed by Red seedless (28 percent, +14 percent), as well as Red Globe (25 percent, -7percent) and Black seedless (3 percent, -20 percent).
For the better part of the previous season, pricing remained strong partly due to Chile starting later; due to logistical constraints, arrival of Chilean grapes was delayed until the start of February.
While pricing this season will also be governed by such dynamics and while rising costs along the logistics chain are a growing concern, it is important to note that Peruvian grapes are growing in demand due to their superior quality.
The country is taking quantum leaps towards growing high quality varieties that are demanded by diverse markets. Additionally, Peru holds a competitive edge over competing industries owing to fewer incidences of adverse weather events, which makes it a reliable supplier in the global context.
(Source: USDA Market News via Agronometrics. Agronometrics users can view this chart with live updates here)
In our ‘In Charts’ series, we work to tell some of the stories that are moving the industry. Feel free to take a look at the other articles by clicking here.
All pricing for domestic US produce represents the spot market at Shipping Point (i.e. packing house/climate controlled warehouse, etc.). For imported fruit, the pricing data represents the spot market at Port of Entry.
You can keep track of the markets daily through Agronometrics, a data visualization tool built to help the industry make sense of the huge amounts of data that professionals need to access to make informed decisions. If you found the information and the charts from this article useful, feel free to visit us at www.agronometrics.com where you can easily access these same graphs, or explore the other 21 commodities we currently track.


Subscribe to our newsletter


