
As part of a breakfast event organized by the International Fresh Produce Association (IFPA) in Chile in late May, Andro Vidal, Commercial Manager at Exportadora Subsole, delivered a detailed presentation on the current state of table grape production and exports in the country, highlighting both the sector’s strengths and challenges.
This IFPA gathering brought together various stakeholders from the fruit and vegetable industry to discuss the future of fresh produce exports, the sustainability of the sector, and opportunities to continue positioning Chile as a key player in international markets.
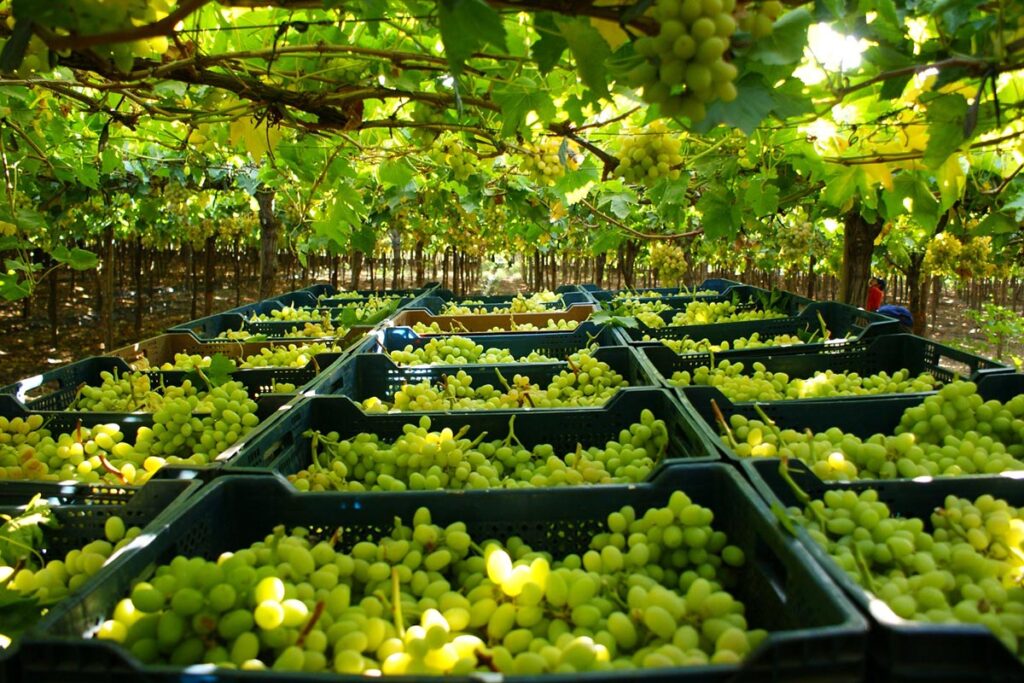
During his presentation, Vidal offered a regional production analysis, emphasizing that Chilean fruit farming spans 1,200 kilometers—from the Copiapó Valley to the Curicó Valley. The production season begins in November (week 45) and extends to approximately week 20 of the following year.
In terms of volume, Vidal noted that the current season concluded with 68 million boxes exported, mainly from the Valparaíso, Metropolitan, O'Higgins, and Maule regions. However, he pointed out a downward trend in some areas, primarily due to drought.
"The Coquimbo region has been declining due to drought issues," Vidal said, noting that while some regions—such as Atacama—remain stable, others have seen significant decreases in their export volumes.
One key uncertainty raised by the Subsole executive was the actual area planted with table grapes in Chile. According to official records from Odepa, 43,000 hectares are planted; however, private estimates suggest that only 25,000 hectares are actively producing for export.
"That’s a challenge: we need to know how much we're actually producing, because there may be more planted than we think," said Vidal.
Vidal’s presentation also previewed a deeper analysis of key export destinations, with a special focus on the U.S. market, and a review of the types of grapes being exported, along with their logistical and commercial challenges.
Another topic addressed by Vidal was the harvest timing, which this year stayed within normal ranges for Chile, with no significant advances or delays. Week 12 marked the peak of shipments, with over 7 million boxes exported. “In the past, when Chile was producing around 100 million boxes, that peak was nearly 10 million,” he recalled.
"Weekly forecast accuracy depends 100% on logistical capacity," he stated, highlighting the collaborative efforts led by Frutas de Chile through working groups involving broad industry participation.
"The total number is usually accurate because 80% of the industry is involved. The big debate is weekly," he noted.
Vidal displayed a graph comparing estimated vs. actual volumes shipped, especially during the early and late weeks of the season.
“If everything were perfect, we would ship exactly what we estimated. But in the late part of the season, there’s a huge gap,” he said, acknowledging that while some fruit may have been shipped late, that alone doesn't explain the full discrepancy. “We face a major challenge in improving this,” he emphasized.
Vidal mentioned that 10 years ago, there were 350 table grape exporters in Chile, and today that number has dropped to 200. “If you look at the top 15 exporters, they account for nearly 70% of the national volume, so the market remains highly concentrated,” he said.
As for markets, the United States remains the top destination. During the 2022–23 season, 30 million boxes were exported to the U.S. A strike in Ica, Peru, that season led to a collapse in the U.S. market, similar to what occurred this year.
In the following season, volume rose to nearly 40 million boxes. In the 2024–25 season, it dropped to 36 million, with varying shipment dynamics.
“Shipment dynamics vary for different reasons—first, the type of shipping vessel, and also the loading capacity during different parts of the season,” the commercial manager added.
Additional issues such as container availability, port congestion, destination logistics, and fumigation requirements contribute to shipping variations throughout the season.
He also pointed to the frequent ocean swells, especially between Christmas and New Year, as another annual challenge the industry must confront.
A large volume of grapes in the U.S. market caused a collapse, with high volumes arriving from multiple origins. California, for its part, had a "normal" season in terms of volume.
"Between weeks 2 and 8, Chile and Peru combined exported 31 million boxes, which is what caused the market collapse in the U.S.," said Vidal.
He added that U.S. buyers often encourage Chilean exporters to ship more, but this can lead to oversupply and market saturation, as happened this year. He emphasized the importance of further discussing this issue.
He also remarked that the U.S. port system is not particularly large, and the logistics at some ports are considered weak.
“We focus mainly on Philadelphia, where the port infrastructure for chartered vessels is small—we have only two ports. As a result, the system collapses quickly because it’s not very robust,” he said.
Analyzing the last four seasons, Vidal stated that last season in the U.S. was “glorious,” while the current one has a fairly similar curve.
“The difficult part about seasons with prices of $15 to $18 per box is that a lot of fruit gets discarded. Commercially, that represents a loss of at least $7 per box, which is a significant amount of money,” Vidal pointed out.
Excluding last season, there have been six to eight weeks where the unit price of grapes has been below production costs, “and that’s something we need to analyze and address,” he added.
Grape consumption in the U.S. has steadily increased in recent years, reaching an average of 10.1 pounds per capita in 2024. This growth is excellent news for exporting countries like Chile, considering that over 60% of the fruit consumed in the U.S. is imported.
Chile, alongside Peru, has played a key role in this trend, accounting for 43% of total imported grape consumption in 2024, thereby reinforcing its lead over competitors such as Mexico. Additionally, the retail channel is highly concentrated, with 90% of sales occurring in supermarkets, requiring highly focused and well-executed strategies.
But it’s not just volume that has increased—the consumer profile has evolved as well. Today, more than 70% of U.S. households consume grapes, and purchase frequency has increased, from once every four weeks to once every three weeks. Large, high-income families are the most frequent buyers, with Boomers (ages 60–80) leading the way, followed by Generation X (ages 40–60).
In terms of preferences, green grapes dominate with a 50% share of the category. In contrast, black grape consumption has declined, primarily due to perceived quality issues.
The fastest-growing category is clamshell-packaged grapes, which now account for approximately 35% of sales.
This landscape reaffirms not only the importance of the U.S. market for Chilean exporters but also the need to adapt to new consumption trends, both in terms of formats and grape varieties.