



Each week, the series ‘Agronometrics In Charts’ examines a different horticultural commodity, focusing on a specific origin or topic and visualizing the trade market factors driving change. Check out our entire archive.
For most of the past decade, China was the undisputed anchor of Australia's table grape export program.
At its peak in 2019/20, the Asian giant absorbed over 40 percent of all Australian table grape shipments, with the country's proximity and growing urban middle class making it the natural first destination for a Southern Hemisphere industry built around premium markets.
That anchor, however, is gone. In 2025/26, Indonesia overtook China as Australia's largest single export destination for table grapes, the first time in the industry's history that any market other than China has held that position.
According to Agronometrics' Global Trade Data, Indonesia received 28,789 metric tons compared to China's 28,003 metric tons in 2025/26, a crossover confirmed by Jeff Scott, CEO of the Australian Table Grape Association, in a FreshPlaza interview on August 26, 2026.
The milestone is the confirmed outcome of a market diversification strategy that Australia's grape industry has been executing, under pressure, for nearly four years.
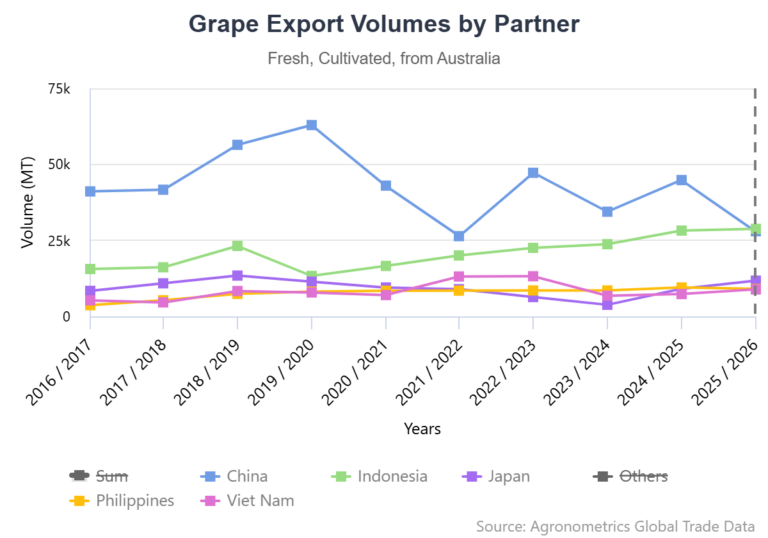
The decline began as China's domestic grape production expanded dramatically. As Chinese consumers shifted away from seeded varieties toward seedless alternatives, local growers rapidly scaled seedless production, according to the USDA FAS Canberra and Rabobank's Table Grape Update 2025, with growing export volumes increasingly present in the same regional Asian markets that Australian exporters had long served.
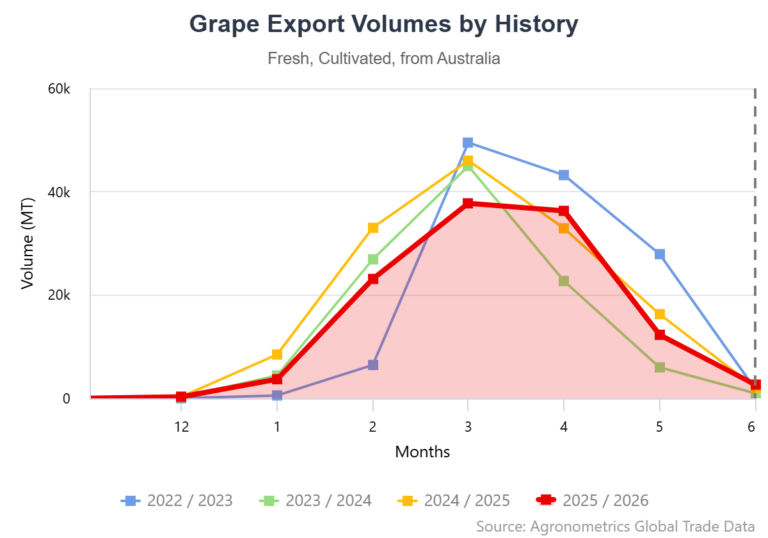
The effect on the Oceanic country's exports was neither linear nor immediate, but it was cumulative. From a peak of 149,076 metric tons in 2019/20, total exports dropped nearly 20 percent by 2020/21, recovered partially in 2022/23, then fell again 18.6 percent to 106,473 metric tons in 2023/24.
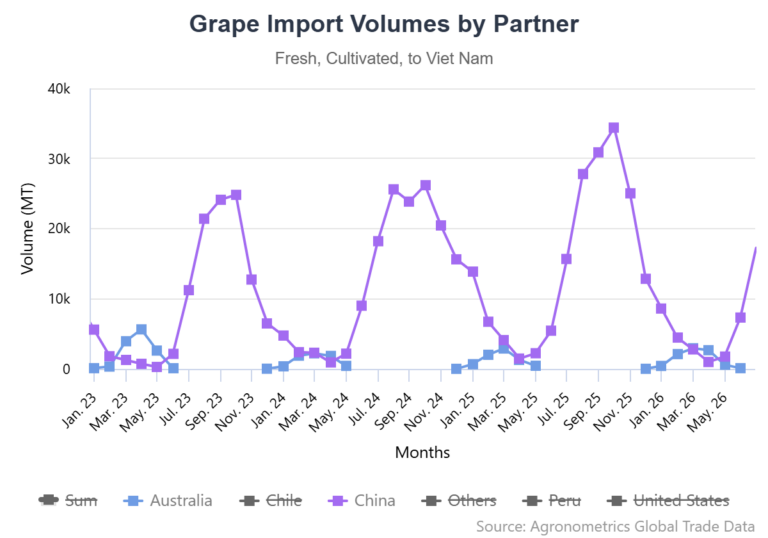
In the single season between 2022/23 and 2023/24, Australian exports to China fell 27 percent, while Vietnam fell 49 percent, and Thailand fell 39 percent. These are all markets where growing Chinese exports exerted increasing price pressure during Australia's January to May export window.
Import data for both Vietnam and Thailand show Chinese grape volumes in that window growing by 193 percent and 33 percent, respectively, between 2022/23 and 2024/25.
Yet the price story across this period reveals that the losses were primarily in volume, not in the long-run value of the fruit that did ship.
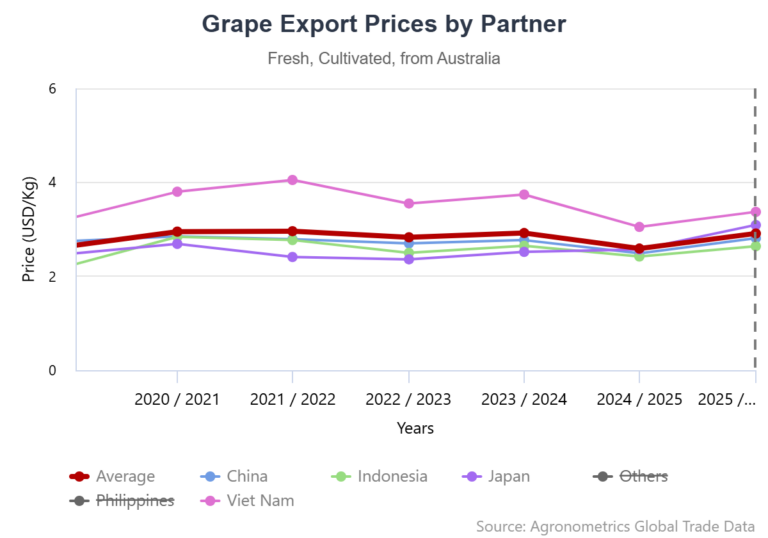
The average FOB export price dipped to $2.59/kg in 2024/25, the lowest in the dataset, before recovering to $2.91/kg in 2025/26, broadly in line with the $2.92/kg achieved in 2023/24. Indonesia, meanwhile, held and grew across every down season as the market most structurally insulated from Chinese price competition.
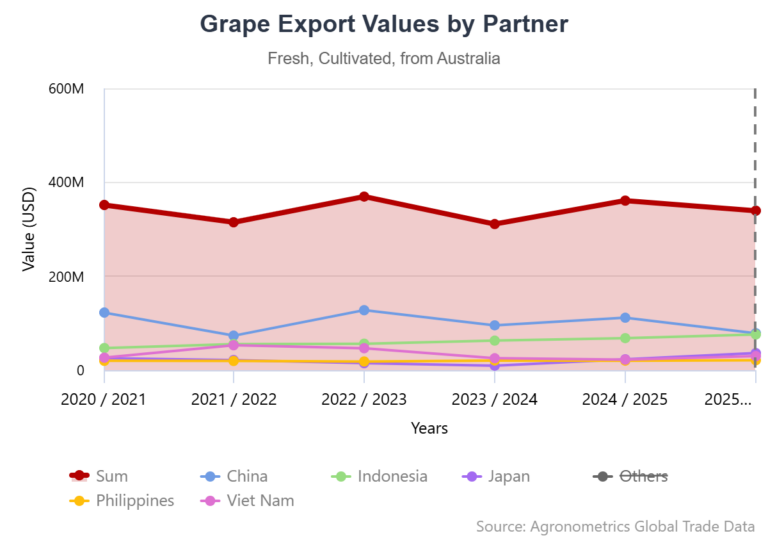
By 2025/26, Australian shipments to Indonesia generated $76.1 million compared to $78.7 million for China. Although Indonesia overtook China on volume, the Asian giant's slightly higher average price ($2.81/kg vs $2.64/kg) meant it retained a narrow value lead.
The recovery in 2024/25 was substantial, with total exports rebounding to 139,272 metric tons and generating $361 million in export value.
One significant driver was Japan. Full varietal access granted in July 2024 opened more than 130 Australian varieties to the island country's market for the first time, driving exports from 3,819 metric tons in 2023/24 to 11,756 metric tons in 2025/26. The average FOB price of Australian grapes exported to Japan also rose from $2.52/kg to $3.07/kg, confirming that the new varieties commanded a meaningful premium amid the previously restricted supply.
In 2025/26, Australian shipments fell 16.3 percent in volume, reflecting vine removals, vineyard restructuring, and above-average rainfall affecting production, per the USDA FAS Canberra, but only 5.9 percent in value.
The fact that Indonesia overtook China in a down year, by a margin of just 786 metric tons, suggests a fundamental reorientation rather than a one-season anomaly.
As Scott told FreshPlaza, Australia's counter-seasonal production window and its reputation as a clean, safe producer give the industry structural advantages in Asia that China's withdrawal has not erased.
As noted in our earlier analysis of China's grape trade, the country's own import collapse is the structural force behind Australia's pivot: for the Oceanic country, the response has been a gradual reorientation toward markets where quality and provenance carry more weight than proximity alone, a trajectory the 2025/26 milestone has confirmed as structural rather than seasonal.
*Main image is referential | Graphs courtesy of Agronometrics
Related stories
How Australian table grapes cracked the code to China exports—and almost lost it all