


Grapes in Charts: Record California volumes reverse Chilean pricing trends


In this ‘In Charts‘ series of mini-articles, Colin Fain of data visualization tool Agronometrics illustrates how the U.S. market is evolving. In each series, he will look at a different fruit commodity, focusing on a different origin or topic in each installment to see what factors are driving change.


In what is a very atypical season, table grape volumes have fallen dramatically over the last few weeks to usher in unusually high prices. In this article I’ll look at how Chile is developing, which will serve as a complement to my previous piece on the subject - Grapes in Charts: How will Chile’s expected crop affect U.S. market against backdrop of low prices?
Grape Prices and Volumes

(Source: USDA Market News via Agronometrics)
[Agronometrics users can view this chart with live updates here]
Although it is normal for prices to increase as volumes fall, what is strikingly abnormal about this season so far is how the pricing dynamics have gone completely against the normal trends, steadily rising throughout the Chilean season as opposed to entering high and slowly falling as the campaign progresses.
Historic Grape Prices from Chile

(Source: USDA Market News via Agronometrics)
[Agronometrics users can view this chart with live updates here]
The cause of this backwardness in the market is an unusually strong production from California, whose market options were also limited by the tariffs imposed by China. As a consequence the U.S. market was flooded with fruit, building up inventories that still needed to be cleared even when Chile’s crop began arriving.
Historic Grape Volumes
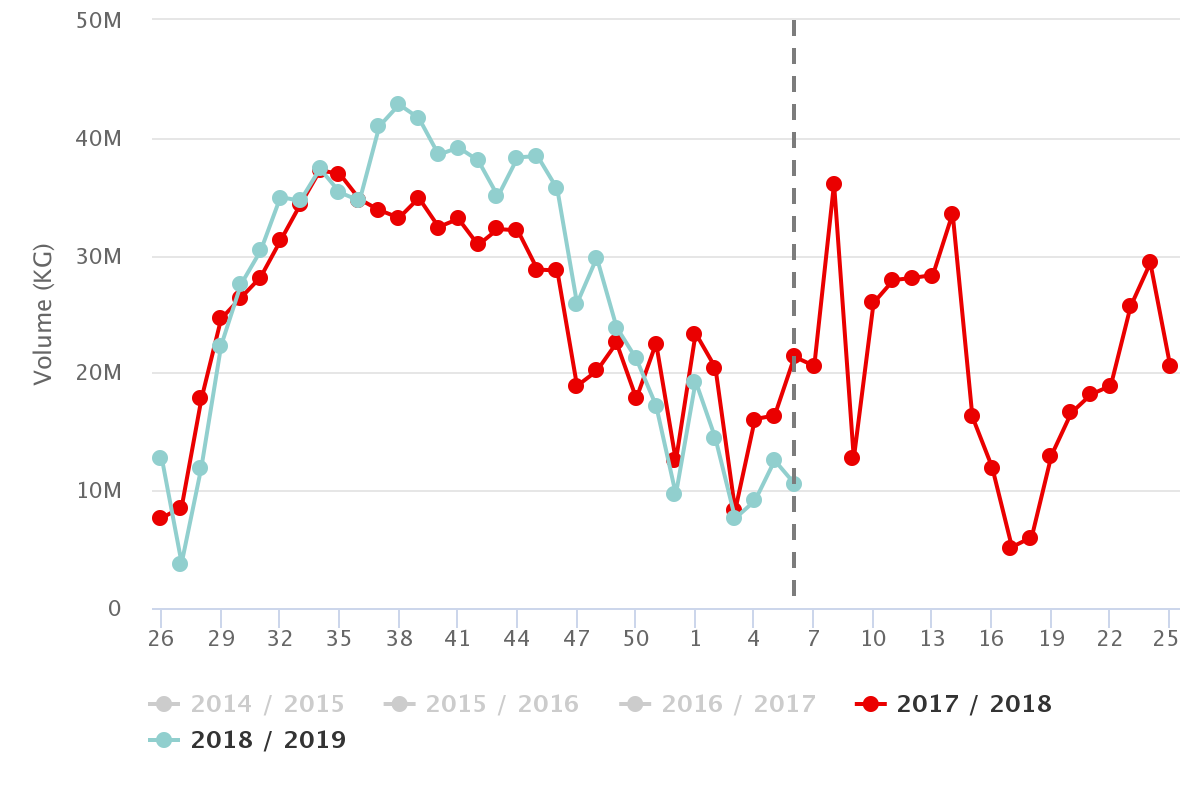
(Source: USDA Market News via Agronometrics)
[Agronometrics users can view this chart with live updates here]
The resulting prices were the lowest we have seen in the last five years from week 39 right the way through week 2.
Historic Grape Prices

(Source: USDA Market News via Agronometrics)
[Agronometrics users can view this chart with live updates here]
Considering that Chile is expected to ship a similar amount to last year, I think that the outlook I published in the last article still holds, and we should see the market shift back to how it normally operates over the next couple of weeks.
On a separate note, as a useful tool for readers to gauge how the markets are currently evolving, we offer weekly pricing by fruit size.
Red Seedless, Non-Organic, Prices by Size
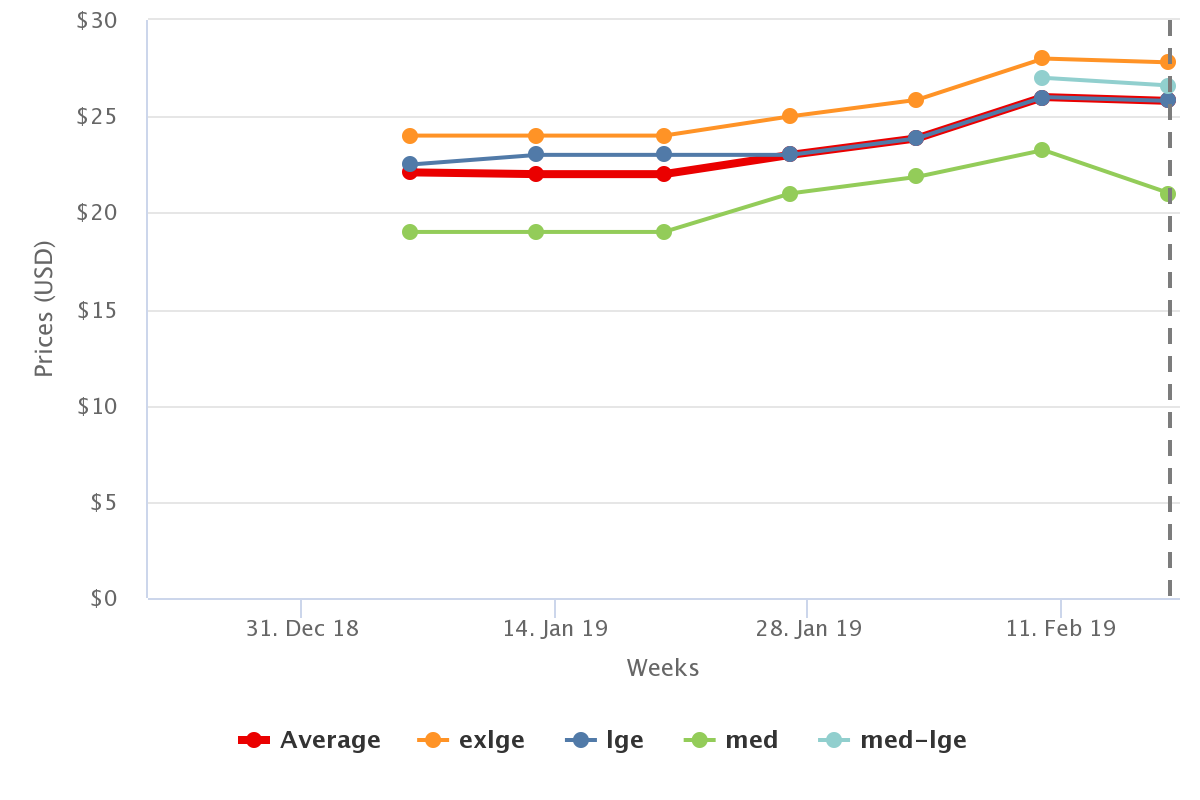
(Source: USDA Market News via Agronometrics)
[Agronometrics users can view this chart with live updates here]
Red Seedless, Non-Organic, Prices by Size (Week 7)
| Sizes | Price Reported |
| Average | $25.80 |
| med | $21.00 |
| med-large | $26.60 |
| large | $25.80 |
| extra-large | $27.80 |
In our ‘In Charts’ series, we work to tell some of the stories that are moving the industry. Feel free to take a look at the other articles by clicking here.
You can keep track of the markets daily through Agronometrics, a data visualization tool built to help the industry make sense of the huge amounts of data that professionals need to access to make informed decisions. If you found the information and the charts from this article useful, feel free to visit us at www.agronometrics.com where you can easily access these same graphs, or explore the other 23 fruits we currently track.


Subscribe to our newsletter


