


Agronometrics in Charts: Growing volumes of Chilean grapes entering the U.S. market


In this installment of the ‘Agronometrics In Charts’ series, Sarah Ilyas studies the progression of the Chilean grape season and evaluates its implications for the U.S. grape market. Each week the series looks at a different horticultural commodity, focusing on a specific origin or topic visualizing the market factors that are driving change.


The US market is currently brimming with grapes. Chile is at the prime of its table grape harvest and heaps of fruit have arrived in the last two weeks with larger volumes to follow in the next few weeks. In the meanwhile, Peruvian grape volumes are dwindling as the season shifts. According to Mark Greenberg of Capespan North America in Montreal, QC, the reason for the influx of Chilean grapes is that the regions that produced the earliest fruit in Chile, specifically the Atacama region, replanted their vineyards with newer varieties that tend to mature later; this pushed the start of the Chilean season a bit later. Greenberg adds that Chilean growers aren’t as inclined to manage their grape crops to come in as early as they are used to. Peruvian table grapes typically dominate the December-January window and Chilean grapes prevail mid-January onward. Peru saw a peak of 27 K tonnes flowing into the US market in January while Chile’s volumes peaked at 30.7 K tonnes in the week of April 3.
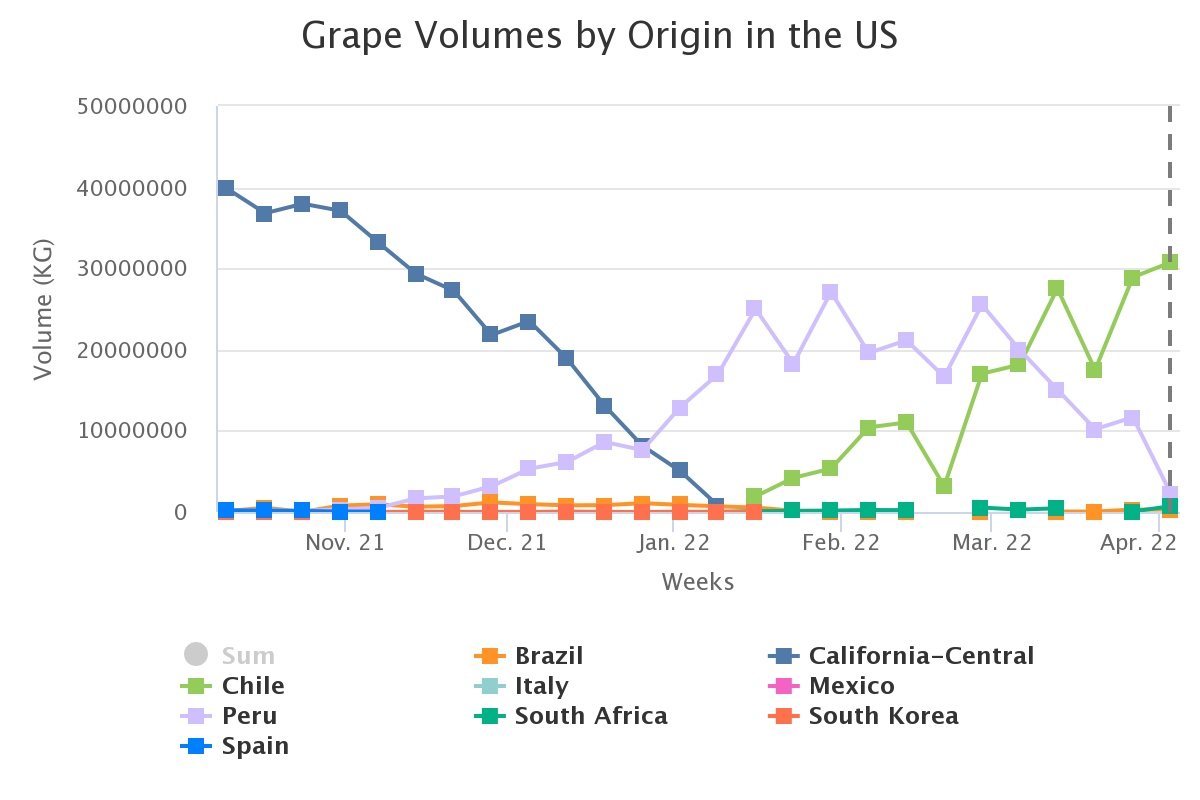
(Source: USDA Market News via Agronometrics. Agronometrics users can view this chart with live updates here)
The Grapevine Genetic Improvement Program (PMGV) of Chile's Agricultural Research Institute (INIA) recently presented a domestically-developed white seedless variety selection, INIA-G3 to industry stakeholders. This nouveau variety of grapes is expected to more easily meet the quality standards necessary to enter the U.S. market “Chilean white seedless grapes used to face challenges getting into the U.S. market during the Marketing Order, but these late varieties of white seedless grapes are solid and strong and with good weather in Chile, we expect to see a white seedless and red seedless grape market that will extend later into the spring.” says Greenberg. ASOEX also unveiled a new red seedless table grape variety developed in Chile that offers a long post-harvest life cycle and an apple-like crunch. Chilean institutions have been doubling down on the development of new table grape varieties, and as claimed by a separate research entity, a white seedless grape variety could be commercially available later this year.
The prices trending in week 13 were around $19.54 per package. Lower prices in the next few weeks are expected to stabilize going forward and create a surge in demand. Retailers still have pricey inventory they needed to sell off before they could mark down their prices.

(Source: USDA Market News via Agronometrics. Agronometrics users can view this chart with live updates here)
The United States is the top export destination for Chilean table grapes, and Chile is the top import supplier for the U.S. market. According to the USDA, Forty-four percent of Chile’s table grape exports are shipped to the U.S. The advent of the new white seedless variety alludes to an even robust Chilean grape market. "It is undoubtedly an alternative that will be well received by the industry. Not only the robustness of the measurements conducted by INIA during several seasons, but also the impressions of our customers who have followed it, speak of a product with great potential,” says Andrés Valdivieso, Commercial Manager of ANA Chile.
In our ‘In Charts’ series, we work to tell some of the stories that are moving the industry. Feel free to take a look at the other articles by clicking here.
All pricing for domestic US produce represents the spot market at Shipping Point (i.e. packing house/climate controlled warehouse, etc.). For imported fruit, the pricing data represents the spot market at Port of Entry.
You can keep track of the markets daily through Agronometrics, a data visualization tool built to help the industry make sense of the huge amounts of data that professionals need to access to make informed decisions. If you found the information and the charts from this article useful, feel free to visit us at www.agronometrics.com where you can easily access these same graphs, or explore the other 21 commodities we currently track.


Subscribe to our newsletter


