

In this installment of the ‘Agronometrics In Charts’ series, Sarah Ilyas analyzes the outlook this season for Mexico white seedless grape varieties. Each week the series looks at a different horticultural commodity, focusing on a specific origin or topic visualizing the market factors that are driving change.
According to the Mexican Table Grapes Growers Association (AALPUM)’s estimates for the upcoming grape season, the harvest from Mexico in 2022 is likely to surpass 25 million boxes this season, a 19.5 percent increase compared to last year and the white seedless variety alone is expected to witness an increase in volume of up to 41.08 percent.
According to a USDA report published in November 2021, however, production forecast for MY 2021/22 was projected at 352,332 MT, seven–percent lower than MY 2020/21 owing to inclement weather and a shortage of rainfall in Sonora and Baja California. Harvest in Sonora kicks off in May and usually ends in July, while in Baja California and other states, harvests occur between June and August. The first harvest is expected to occur in the beginning of May, and picking up momentum from May 15th onward.
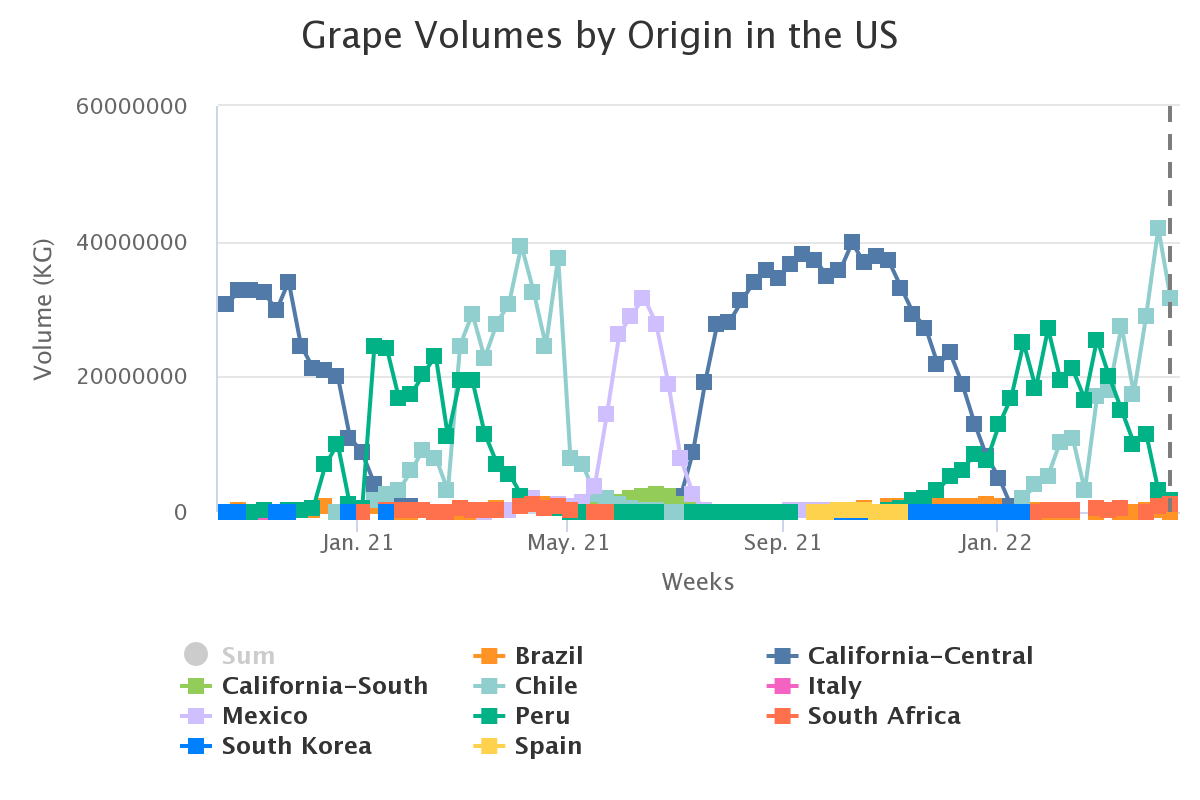
The last season witnessed a cumulative volume of 31.7 K tonnes of table grapes arriving into the US market from Mexico, 24 percent lower than the volume seen coming in from Chile.
Week 7 saw a total of 635 K kgs of Mexico white seedless grape varieties reaching the US market. The peak imported quantities for last season were 7.5 K tonnes in week 23. “The next 6-8 weeks should bring plenty of opportunity to promote premium red seedless varieties at very attractive prices delivering great value for consumers”, said Antonio Escobar, Grapes Category Manager of Divine Flavor in an industry publication.
“White seedless grape supplies will also continue steadily and we’re expecting decent volumes of Sweet Globe and Autumn Crisp coming from Peru, Chile, and South Africa,” he added.
Roughly 7.4 million boxes of table grapes are expected in May and peak volumes of 16.59 million boxes are expected in June. The season is expected to stretch until mid of July this year with a total of 1.45 million boxes.

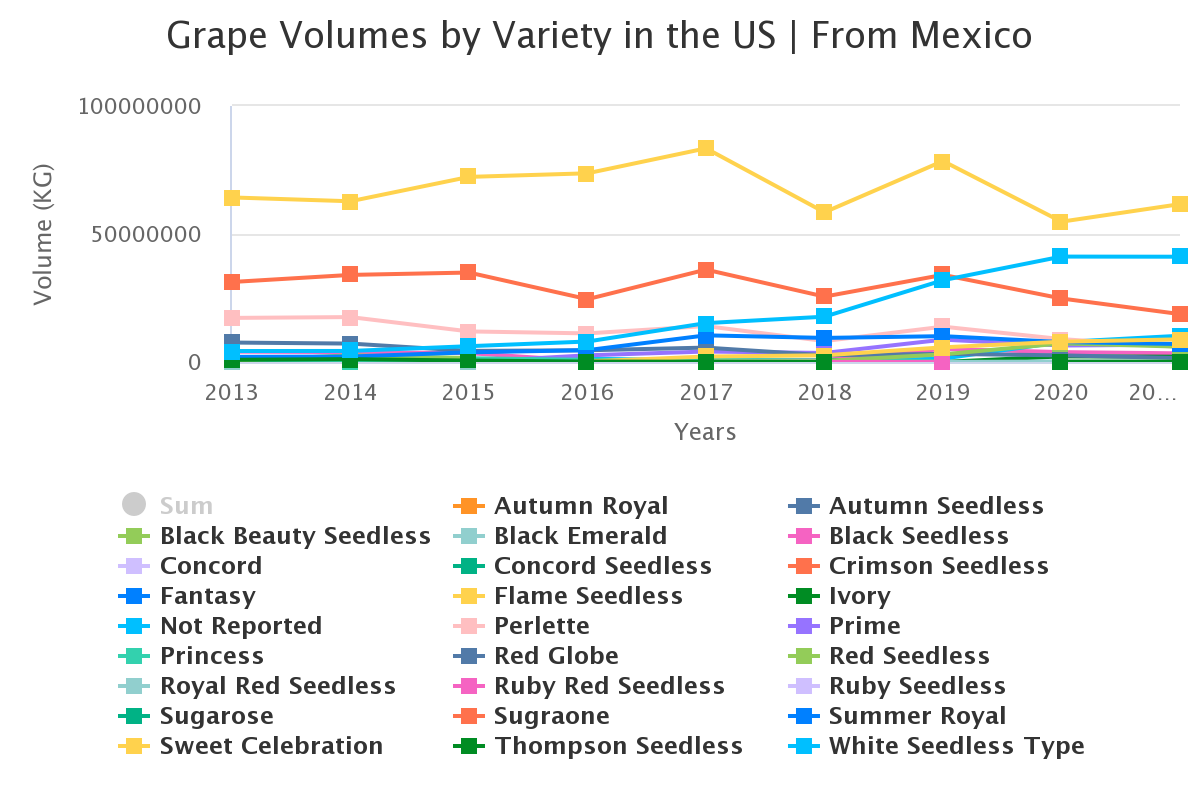
The graph below gives a breakdown of grape volumes by variety. White seedless witnessed the second highest volumes last season, just behind flame seedless.
As can be noted below, prices in the last season ranged from $17.95 to $38.95 per 18 lb containers. According to a recent USDA report, a significant price drop is expected for the white seedless variety for the upcoming season, by as much as 26%.
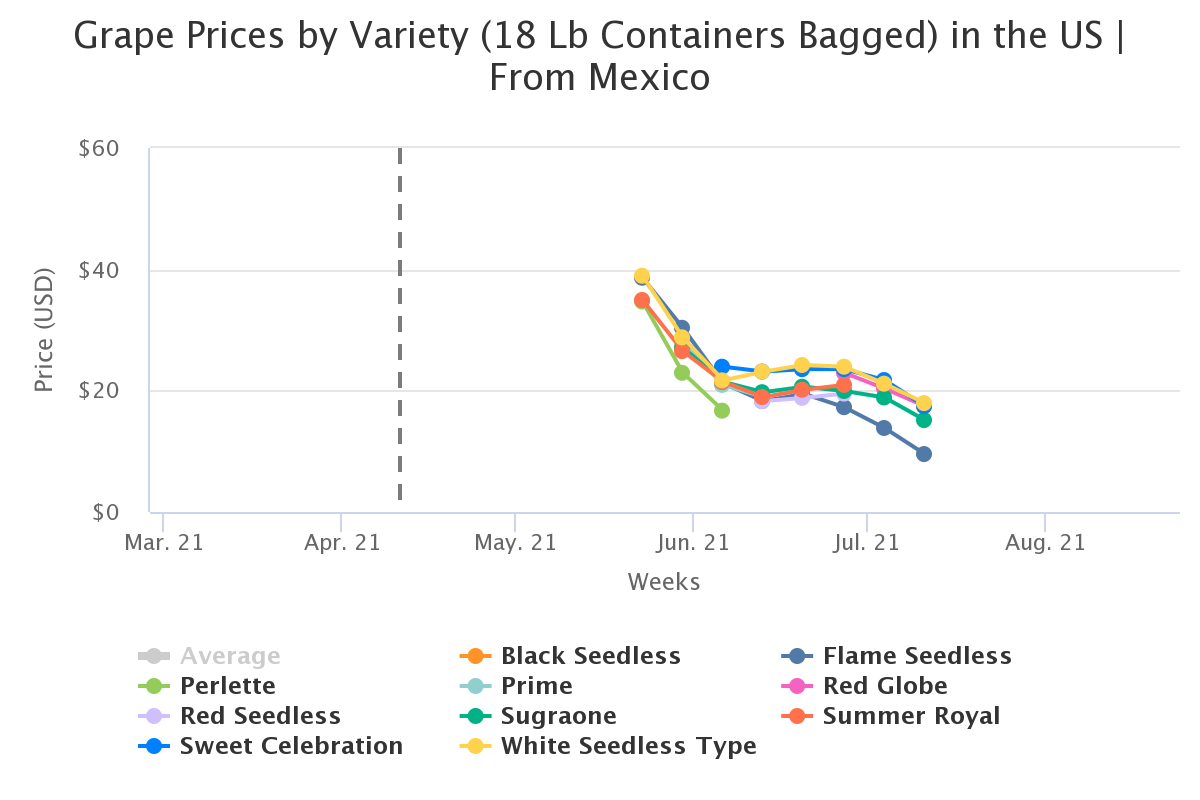
Table grape production in the state of Jalisco has escalated in recent years with experts estimating that another couple million boxes of exportable grapes will be produced in the state.
The harvest season in Sonora is expected to commence in early May and last until mid-July. For its estimate, AALPUM projected about 7.5 million boxes in May, 16.6 million boxes in June and close to 1.5 million boxes in July. The majority of the crop is expected to be shipped during a six-week period stretching from week 20 through week 25. Weather and market changes will likely determine the outlook for the remainder of the season.
In our ‘In Charts’ series, we work to tell some of the stories that are moving the industry. Feel free to take a look at the other articles by clicking here.
All pricing for domestic US produce represents the spot market at Shipping Point (i.e. packing house/climate controlled warehouse, etc.). For imported fruit, the pricing data represents the spot market at Port of Entry.
You can keep track of the markets daily through Agronometrics, a data visualization tool built to help the industry make sense of the huge amounts of data that professionals need to access to make informed decisions. If you found the information and the charts from this article useful, feel free to visit us at www.agronometrics.com where you can easily access these same graphs, or explore the other 21 commodities we currently track.