
In this installment of the ‘Agronometrics In Charts’ series, Sarah Ilyas studies the state of the Chilean grape market within the US. Each week the series looks at a different horticultural commodity, focusing on a specific origin or topic visualizing the market factors that are driving change.
Following a steady four-year slump in production due to intermittent droughts and adverse weather conditions in Chile, things are finally starting to look up. According to the USDA GAIN report, table grape production is projected to increase by 22 percent, reaching 805,000 metric tons in 2021-22. A diversification in proprietary varieties is causing yields to increase manifold. On the flipside, growers are still beset with issues such as rising input costs and exorbitant fertilizer rates.
With almost 30% of its growing area dedicated to grapes, Chile has established itself as the dominant producer of table grapes in the southern hemisphere and the world.
The arid climate provides optimal conditions for the production of high quality fruit. Additionally, Chile is continuing to research new and diverse grape varieties. Although the country is renowned for varieties such as Red Globe, Crimson and Thompson Seedless, it has popularized a multitude of new varieties in the world market, focusing on superior condition, taste and size.
“During the 2021-22 season, shipments of new varieties are expected to reach 35 million boxes, followed by traditional varieties with 32 million boxes, and Red Globe with a little more than 17 million boxes,” says Karen Brux, managing director of the Chilean Fresh Fruit Association.
“Although there are still traditional varieties such as Red Globe, our statistics show a continuous decline in their export volume,” she adds.
Ronald Bown, President of ASOEX, said: “In this first estimate for the table grape shipping season 2021-2022, we have predicted that Chile will export around 84.6 million standardized boxes of 8.2 kilos. This projection reflects an increase of 14.9 percent in relation to the 2019-2020 season, and an increase of 29.3 percent with respect to the 2020-2021 season, in which production was impacted by unexpected summer rains."
The peak volume recorded this season was 11,000 ton, a 36 percent increase compared to the previous year. Week 7 saw volumes dropping to 3,000 ton. Chile generally ships until the end of April with peak supplies from mid-February to the end of March. The incoming volumes are likely to culminate in the next few weeks .

Getting premium quality grapes into markets is of primary concern for Chile at the moment. Logistical difficulties currently stand in the way of achieving these ends. A pest risk assessment of a long-awaited systems approach was recently published by USDA’s Animal and Plant Health Inspection Service (APHIS) for Chilean table grape imports; this implementation is likely to diversify Chile’s market access by boosting quality.
Although an approval is currently pending, the ratification of this proposal would mean that it would no longer be necessary for Chilean table grape exporters to use methyl bromide fumigation on fruit sent to the U.S. “This would result in higher fruit quality and lower costs,” says Karen Brux.
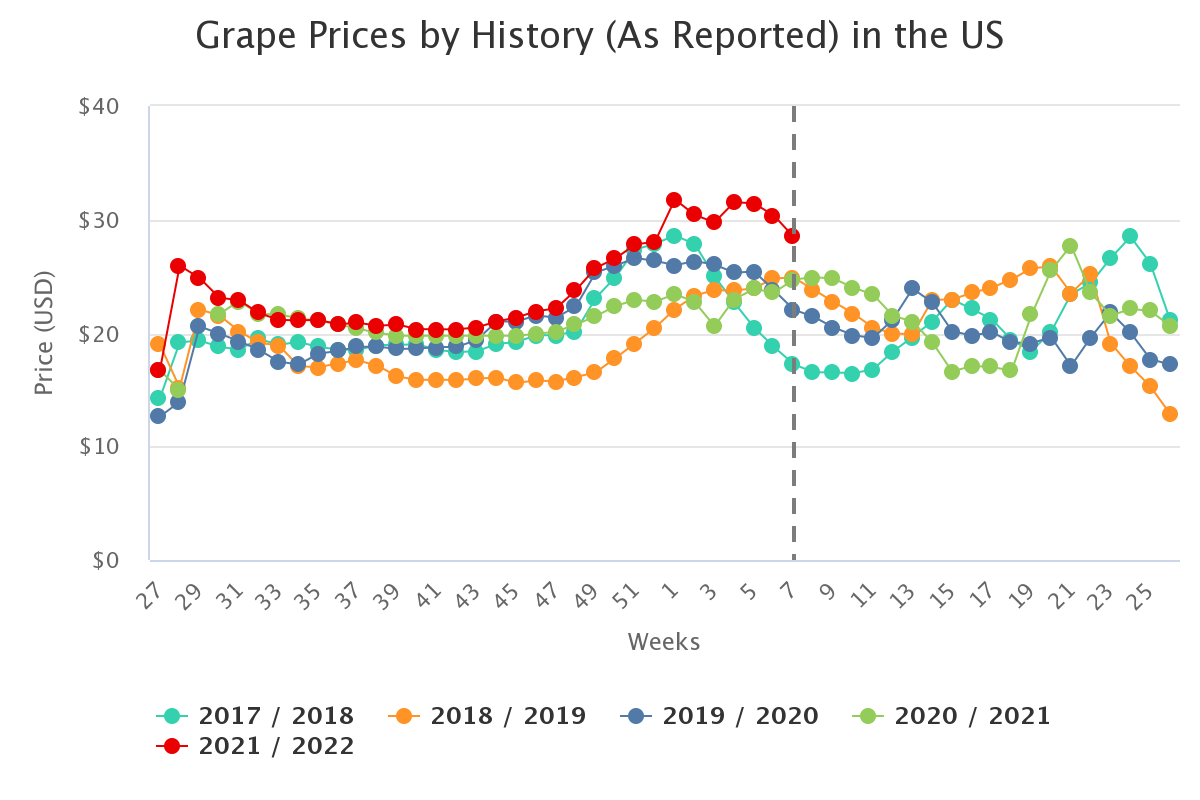
Prices have been at their highest out of the last five years. The peak price this season was $33.33 per package in week 5, a 51 percent spike compared to the corresponding week in the last season.

The last couple of months saw low volumes of all varietal groups, especially in white seedless and red seedless, which kept prices climbing throughout the period, with peak prices at $31.7.
The outlook for the remainder of the season will largely depend on the usual push and pull of supply and demand as well as factors such as rising input costs and steep labor rates.
In our ‘In Charts’ series, we work to tell some of the stories that are moving the industry. Feel free to take a look at the other articles by clicking here.
All pricing for domestic US produce represents the spot market at Shipping Point (i.e. packing house/climate controlled warehouse, etc.). For imported fruit, the pricing data represents the spot market at Port of Entry.
You can keep track of the markets daily through Agronometrics, a data visualization tool built to help the industry make sense of the huge amounts of data that professionals need to access to make informed decisions. If you found the information and the charts from this article useful, feel free to visit us at www.agronometrics.com where you can easily access these same graphs, or explore the other 21 commodities we currently track.